

Recently, a number of economists and other commentators have suggested that a weak labour market is one of the big factors holding back New Zealand's economic recovery.
Although there are signs that our recovery this time around is somewhat weaker than past ones, these comments reflect a misunderstanding of the role the labour market plays in economic cycles.
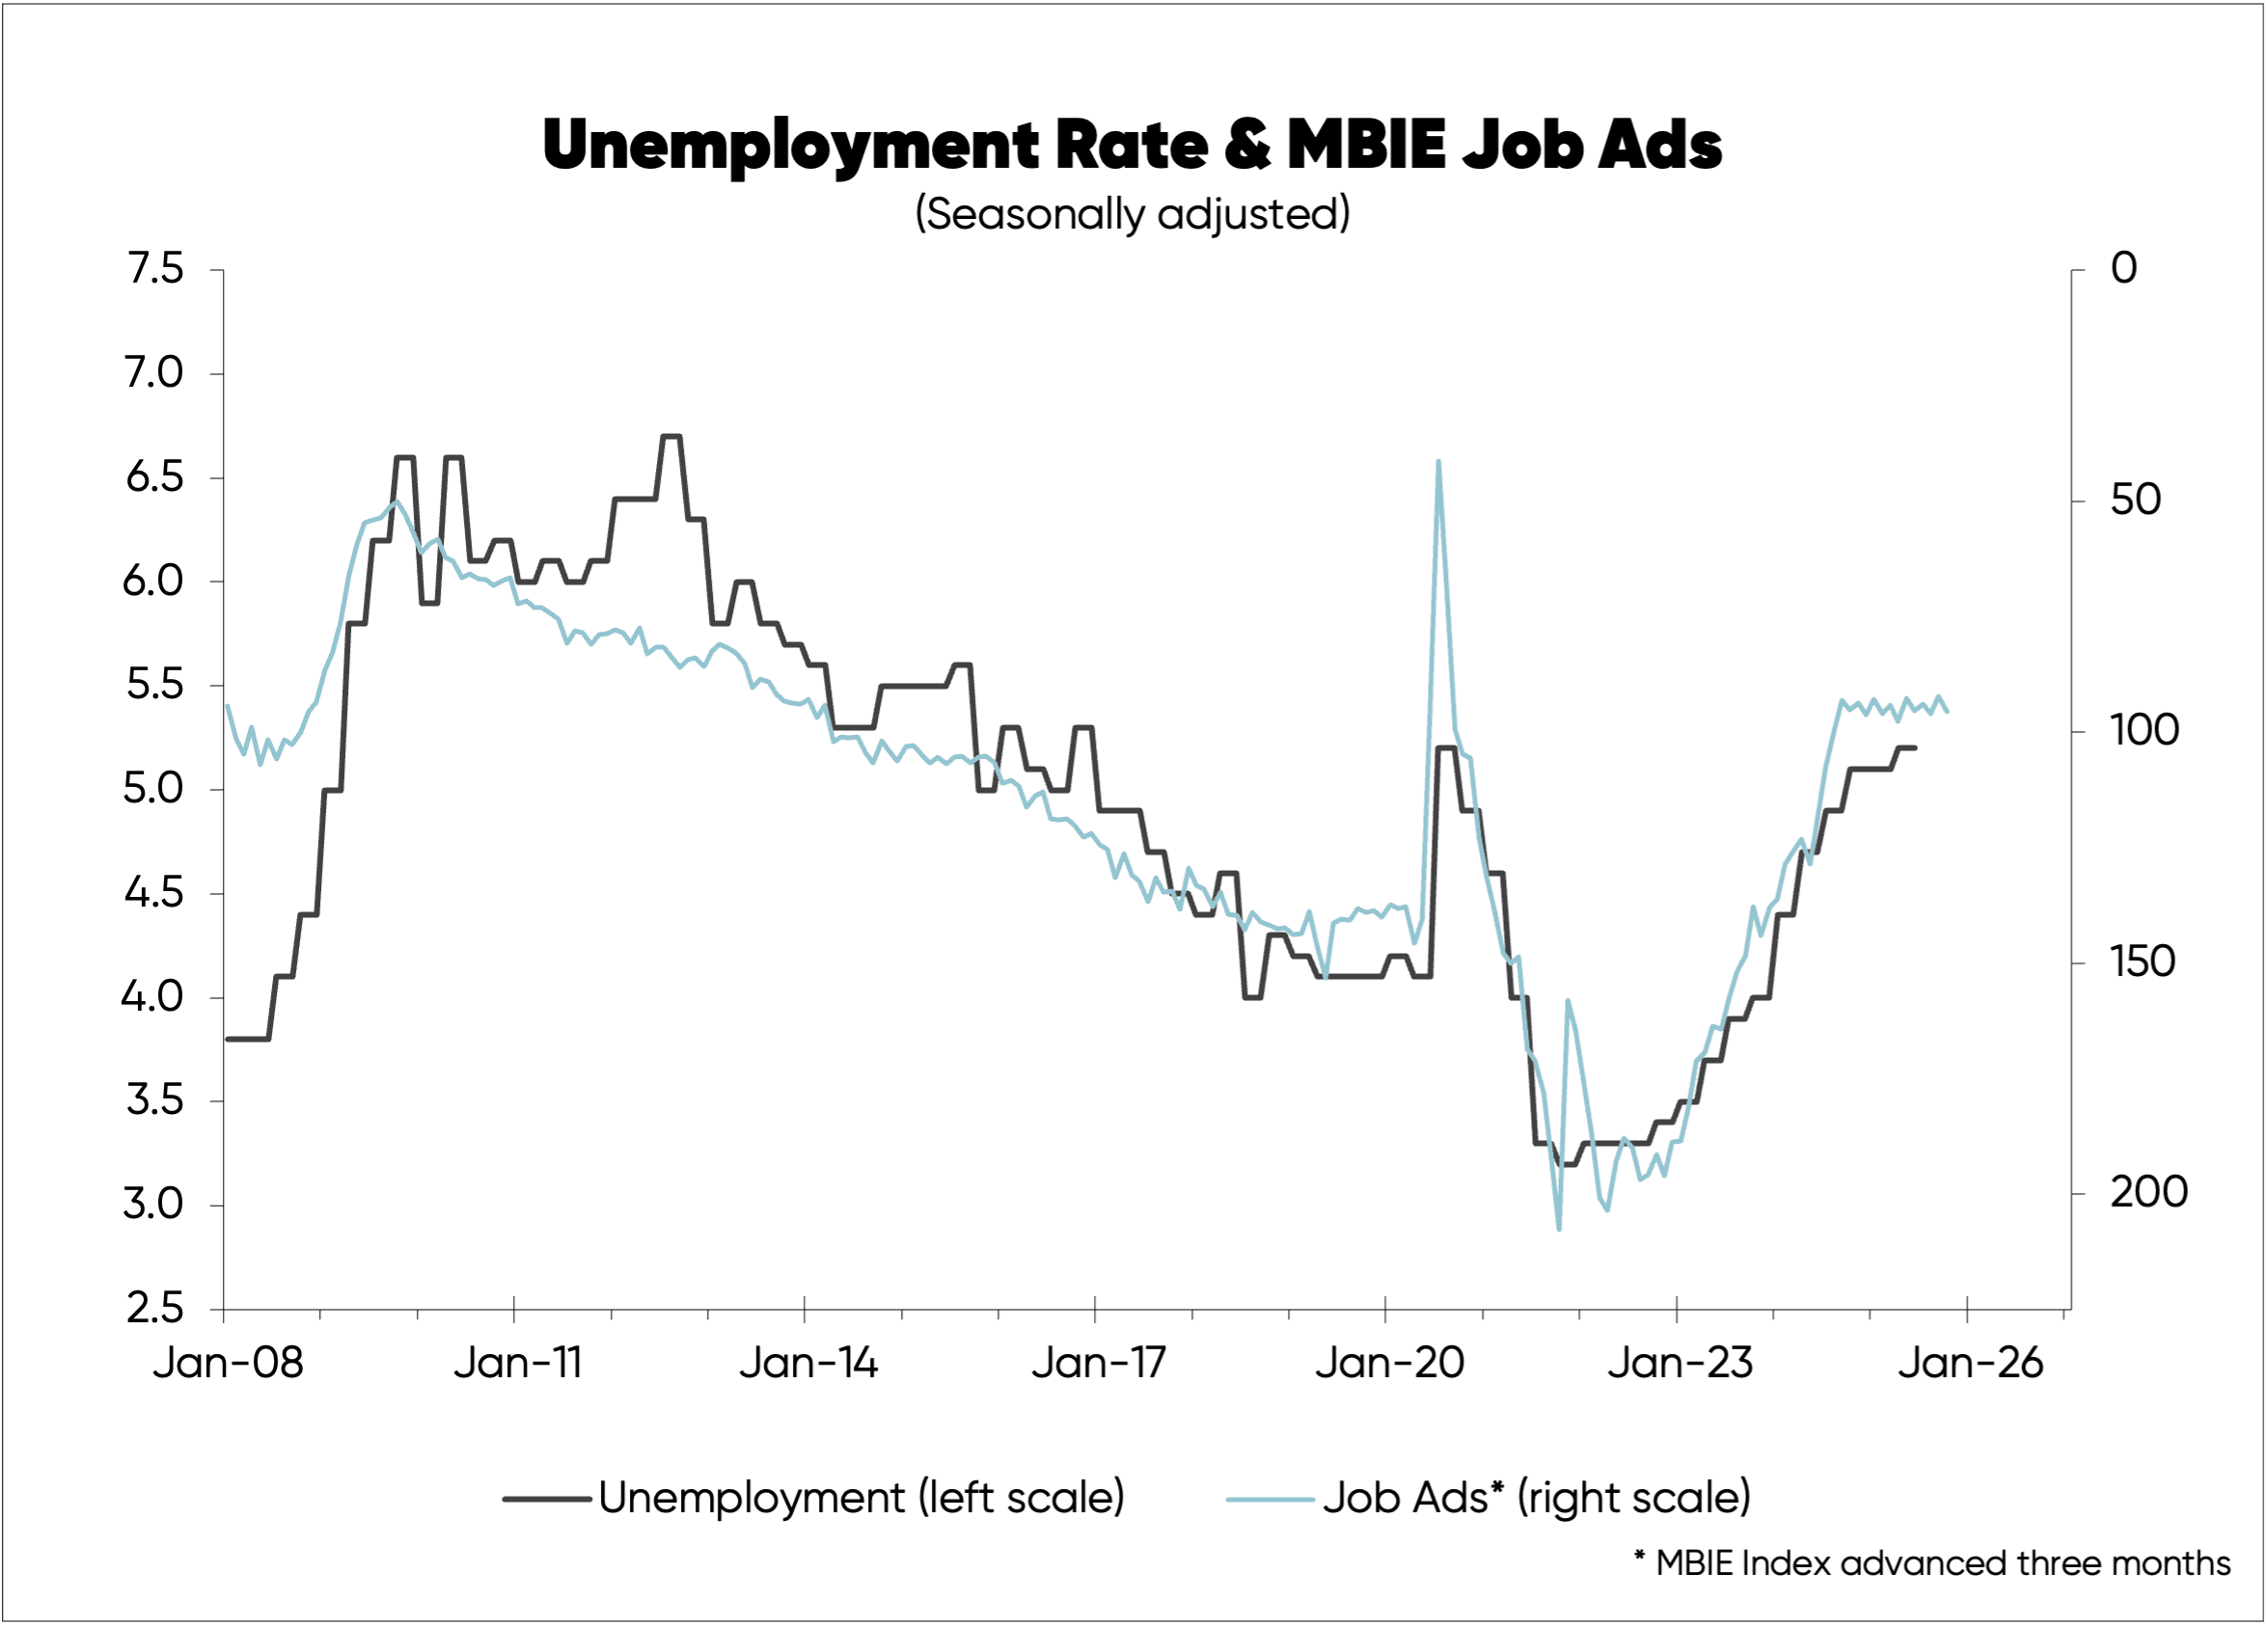
The unemployment rate, arguably the best indicator of the state of the labour market, rose to 5.2% in the June 2025 quarter. This is on par with where it peaked in 2020—following the Covid recession—but well below previous peaks.
MBIE job ad data can be a useful leading indicator for the unemployment rate, and current numbers suggest we're nearing the peak for this cycle, as you can see in the first chart below.
The second chart tracks annual growth in the volume of retail spending alongside the unemployment rate.
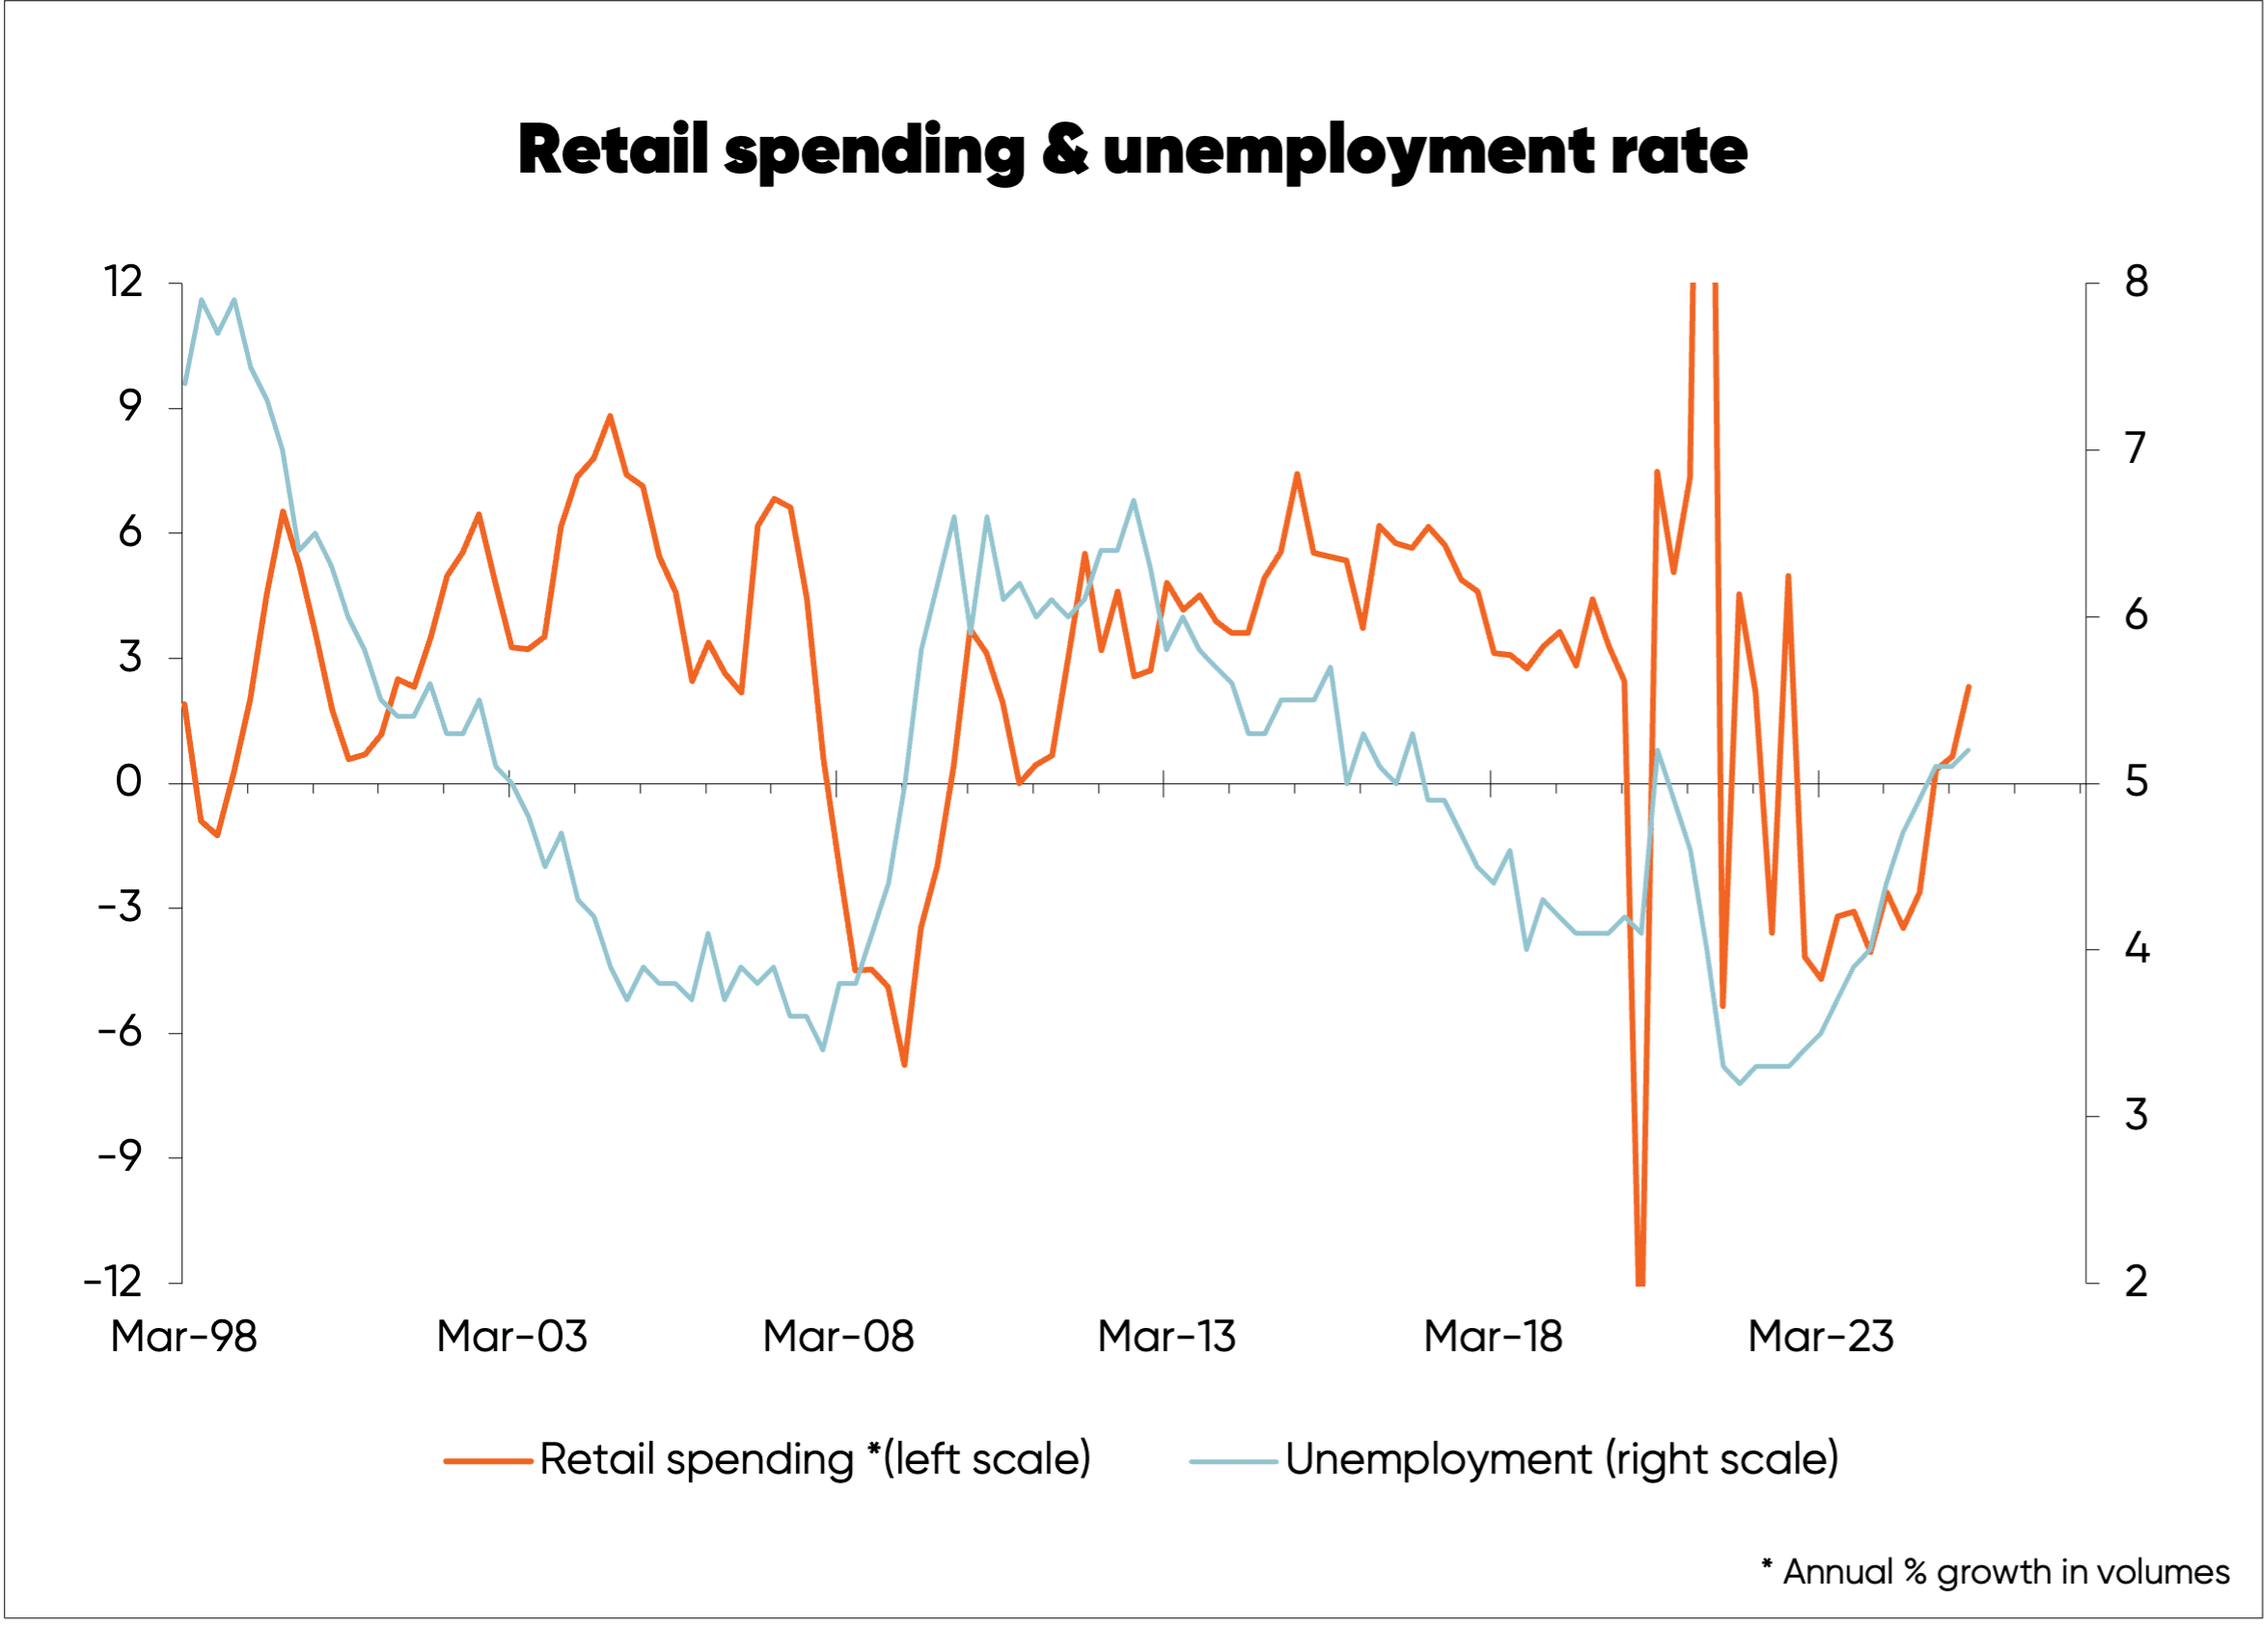
Correlation is an indication of how closely two variables are linked. Since 1998, the correlation factor between annual growth in retail spending and the unemployment rate is 0.01—with the maximum possible being 1. That’s like getting 1% on an exam.
The volume of retail spending in the 2025 June quarter was up 2.3% on a year ago despite unemployment rising over that period.
This is a similar result to what we saw when the unemployment rate rose in response to the 2008/09 major recession, coupled with the 2010 mini recession, to peak at 6.7% in the 2012 September quarter.
In the 2012 September quarter, retail spending volumes were up 2.6% on the same quarter in 2011 despite a rising unemployment rate.
The third chart, below, shows the best fit between annual employment growth and annual GDP/economic growth is with the latter leading or advanced by one quarter.
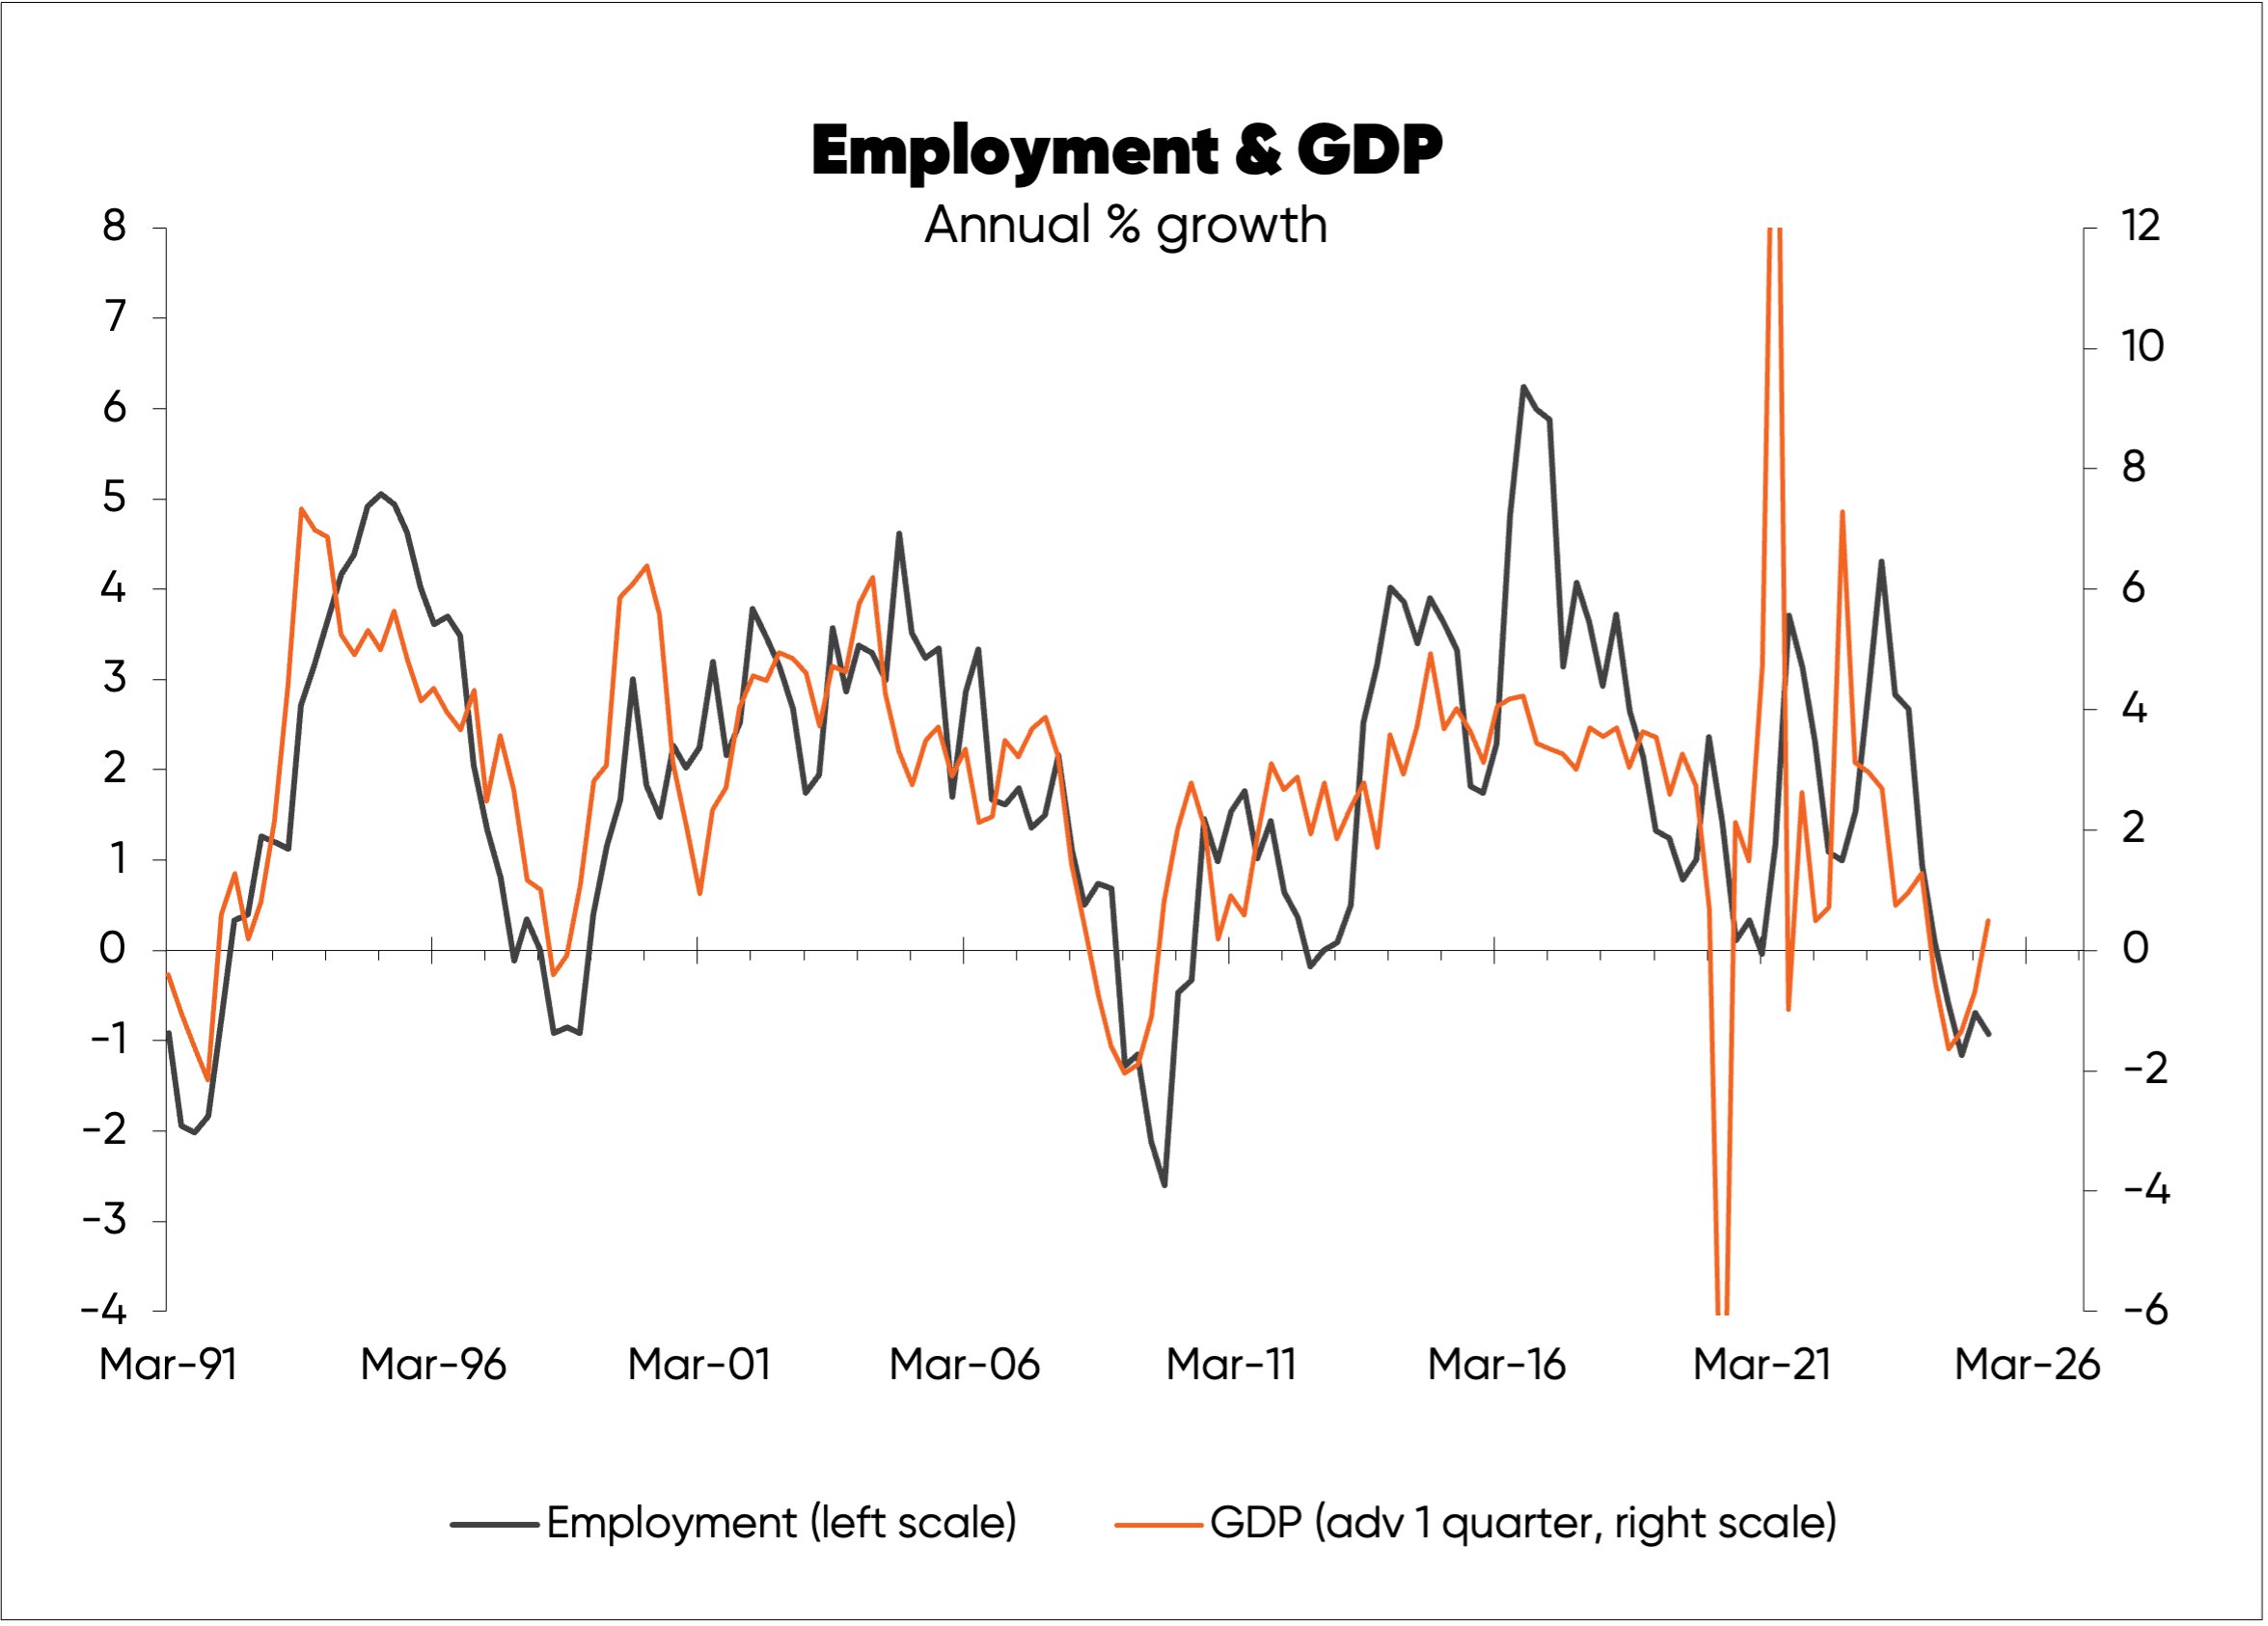
In other words, employment growth and / or the unemployment rate reflect what has been going on with economic growth—rather than being key drivers of it. Meaning economists and other commentators have got things the wrong way around
A rise in retail spending over the last year somewhat belies suggestions the recovery from the 2024 recession is weaker than normal. However, the housing market and especially house prices aren’t experiencing normal recoveries.
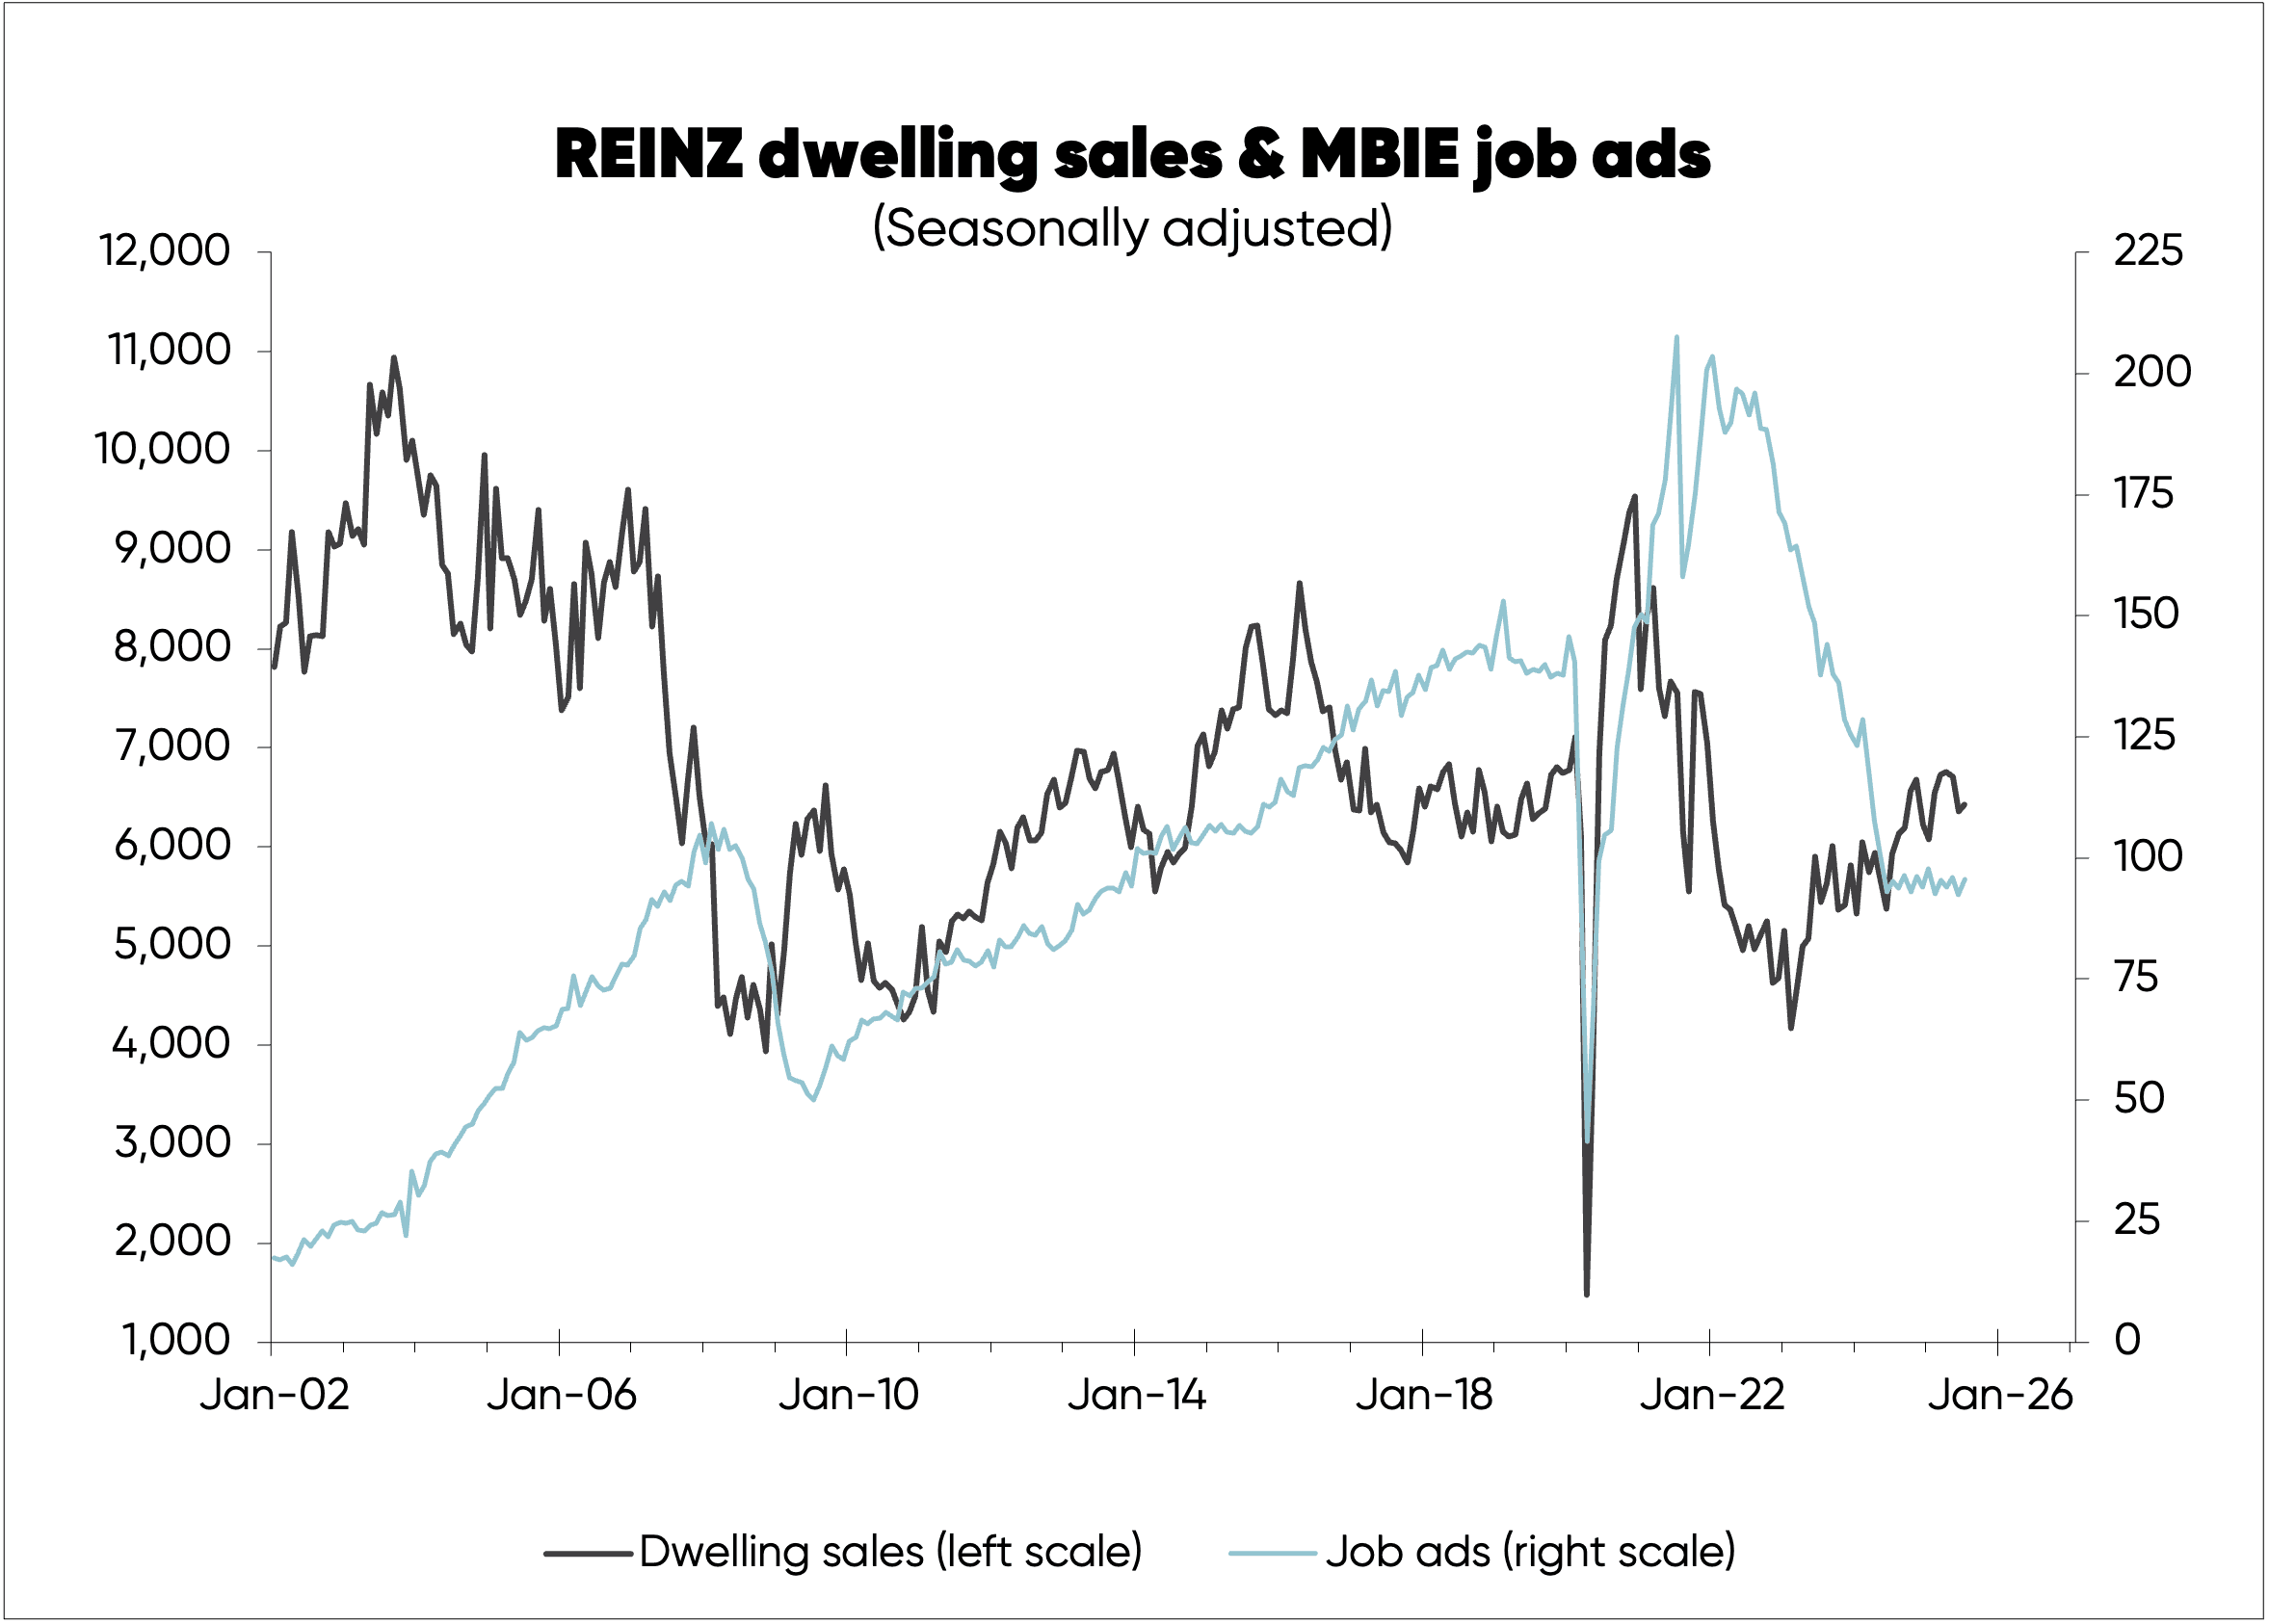
Like retail spending, dwelling sales reported by REINZ show no clear link with the unemployment rate, as you can see in the fourth chart below.
There are other gremlins at work in the housing market which will mean a somewhat weaker than normal initial recovery in economic growth from the 2024 recession.
But this will encourage the Reserve Bank to cut the OCR more and help fuel economic growth.
By Rodney Dickens, Managing Director, Strategic Risk Analysis Ltd www.sra.co.nz.