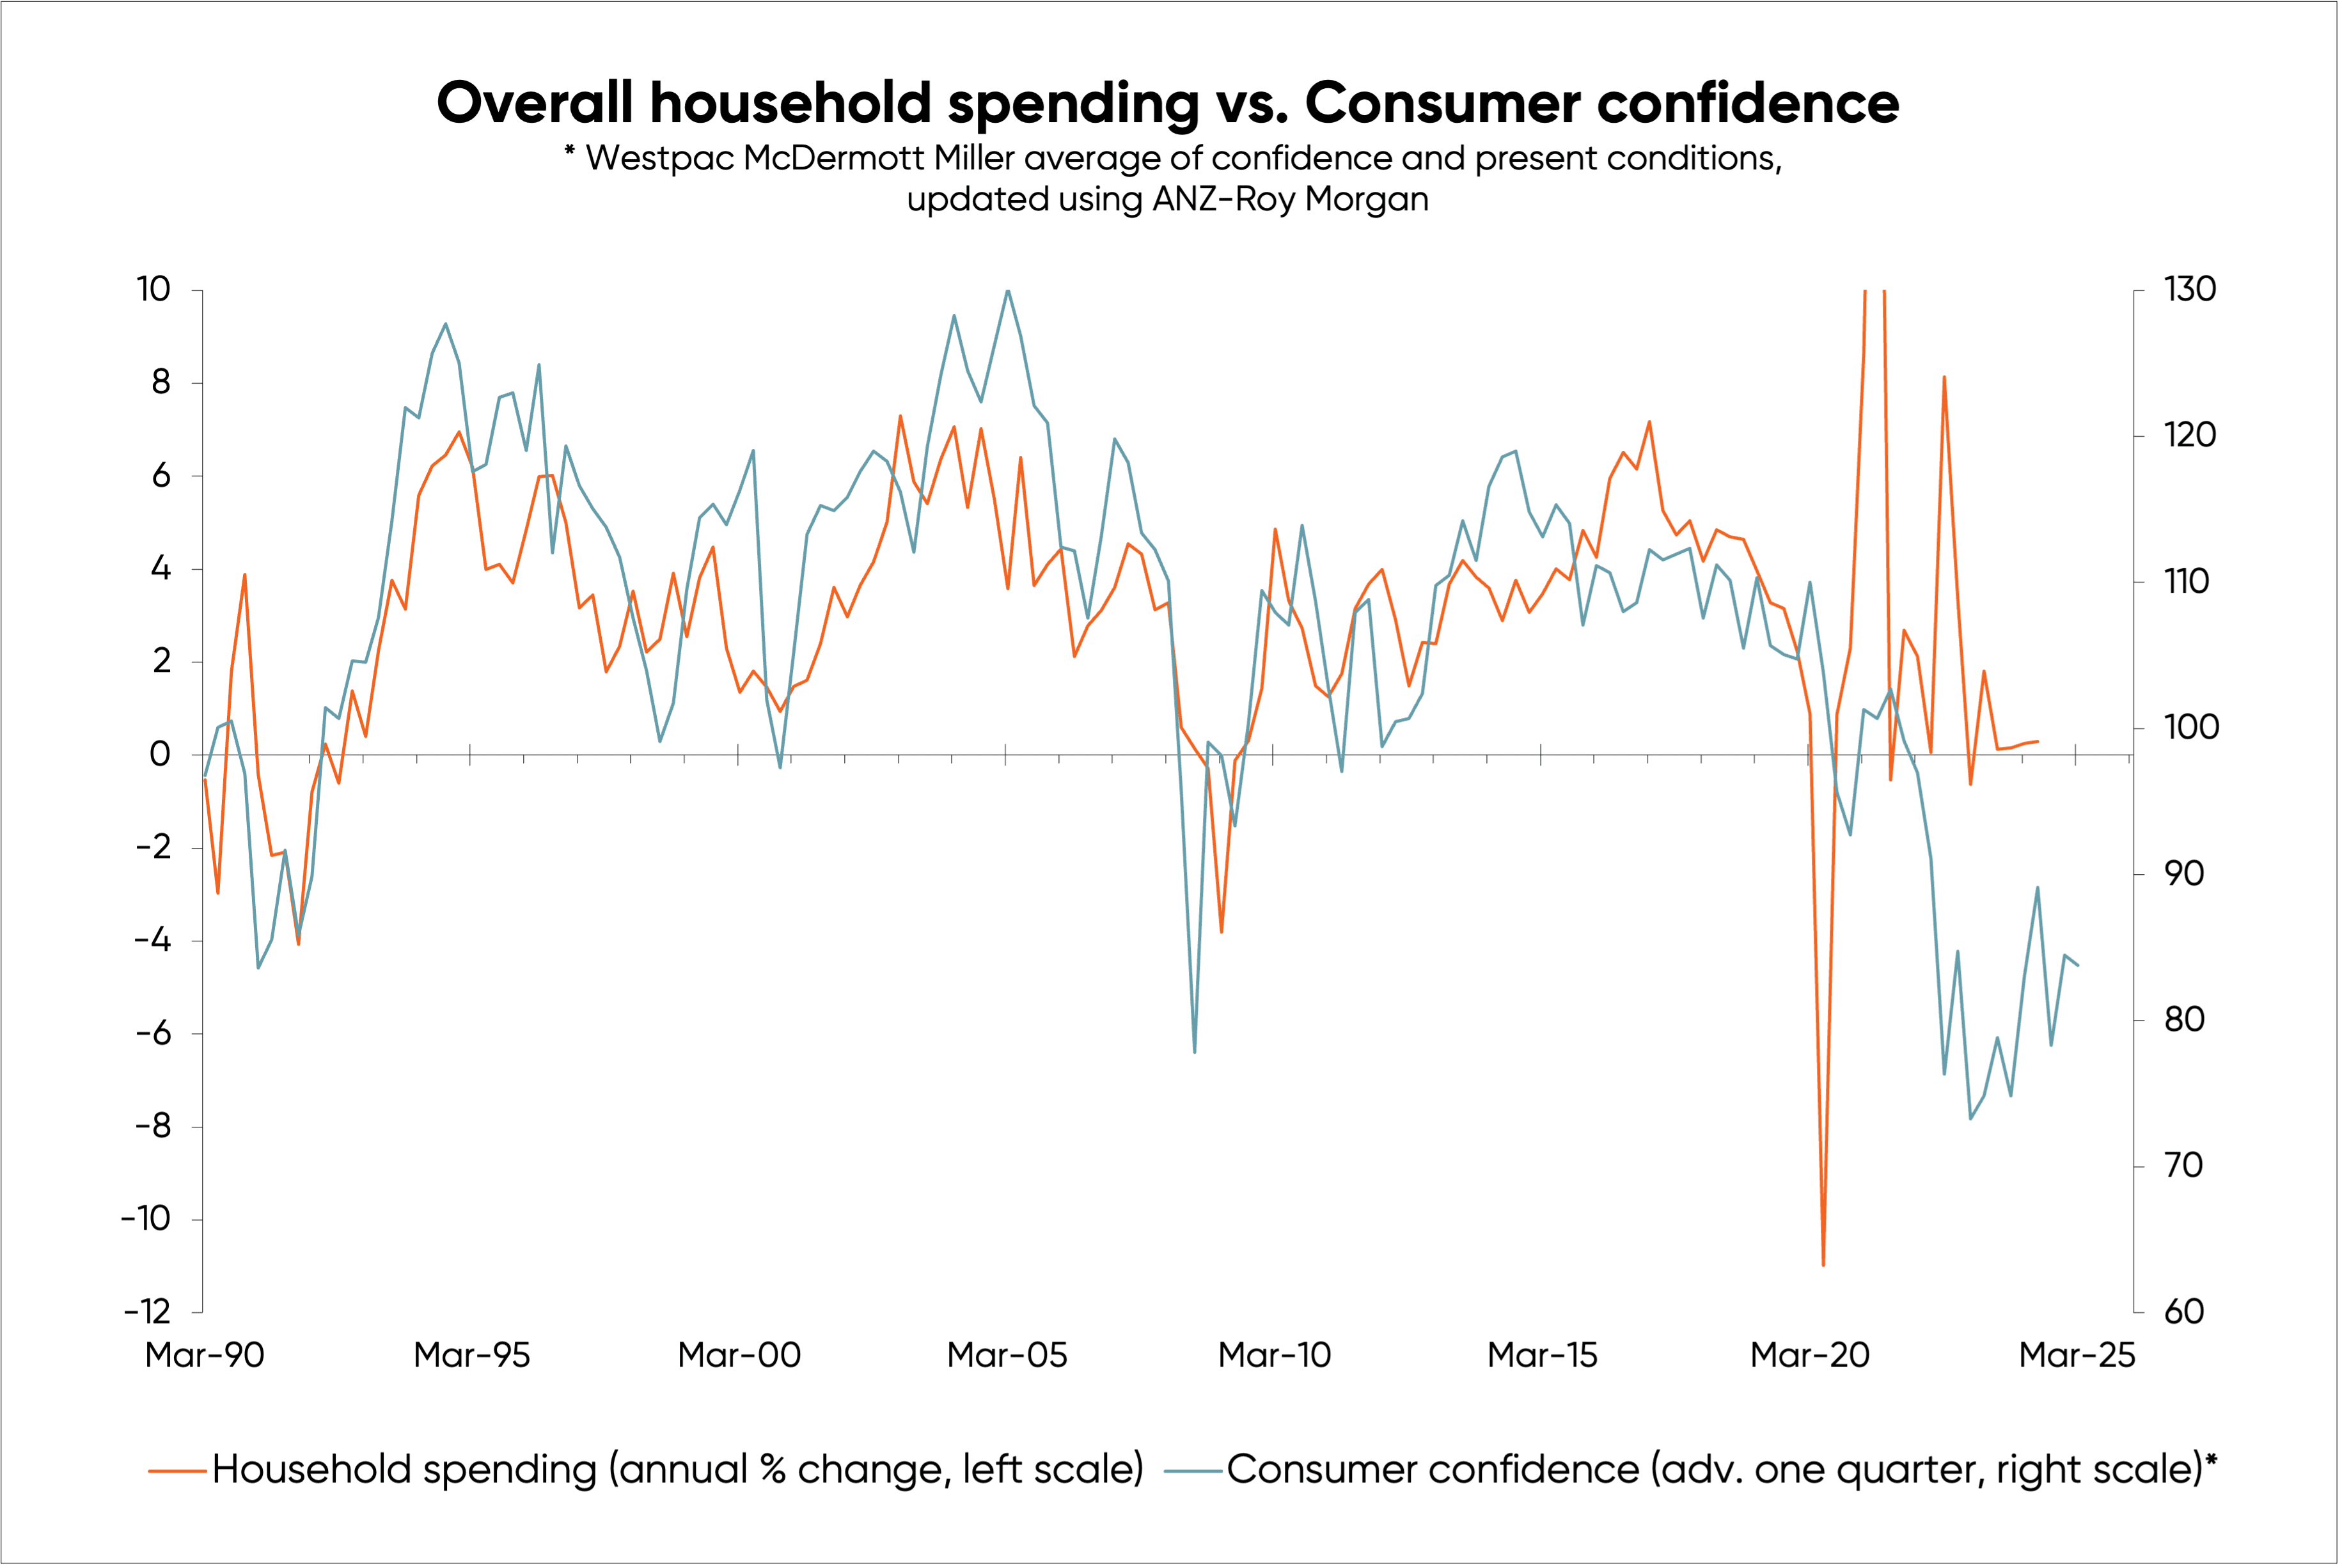
Despite consumer confidence surveys being at all-time lows in the last couple of years, the fall in levels of household spending have been surprisingly muted.
This suggests that something may not be quite right with Statistics NZ's measurement of household spending.
If true, this would have implications for economic growth (with household spending beings its largest component)—and could possible mean the current recession is worse than the modest one being reported by Stats NZ.
Prior to the spikes and tumbles in household spending caused by COVID-19, there was a relatively close relationship between household spending and the results of the consumer confidence surveys—as shown in the first chart, below. The best fit was with the consumer survey results advanced or leading by one quarter.

Driven mainly by the sharpest ever increase in interest costs, in 2022 the consumer survey fell to recessionary lows where it has largely remained.
In past recessions, negative confidence measures have been followed by moderate falls in household spending. This time, Stats NZ has reported no recessionary-scale fall in spending. While opening the international border in 2022 will have helped boost spending, this boost will have faded, leaving the puzzle unanswered.
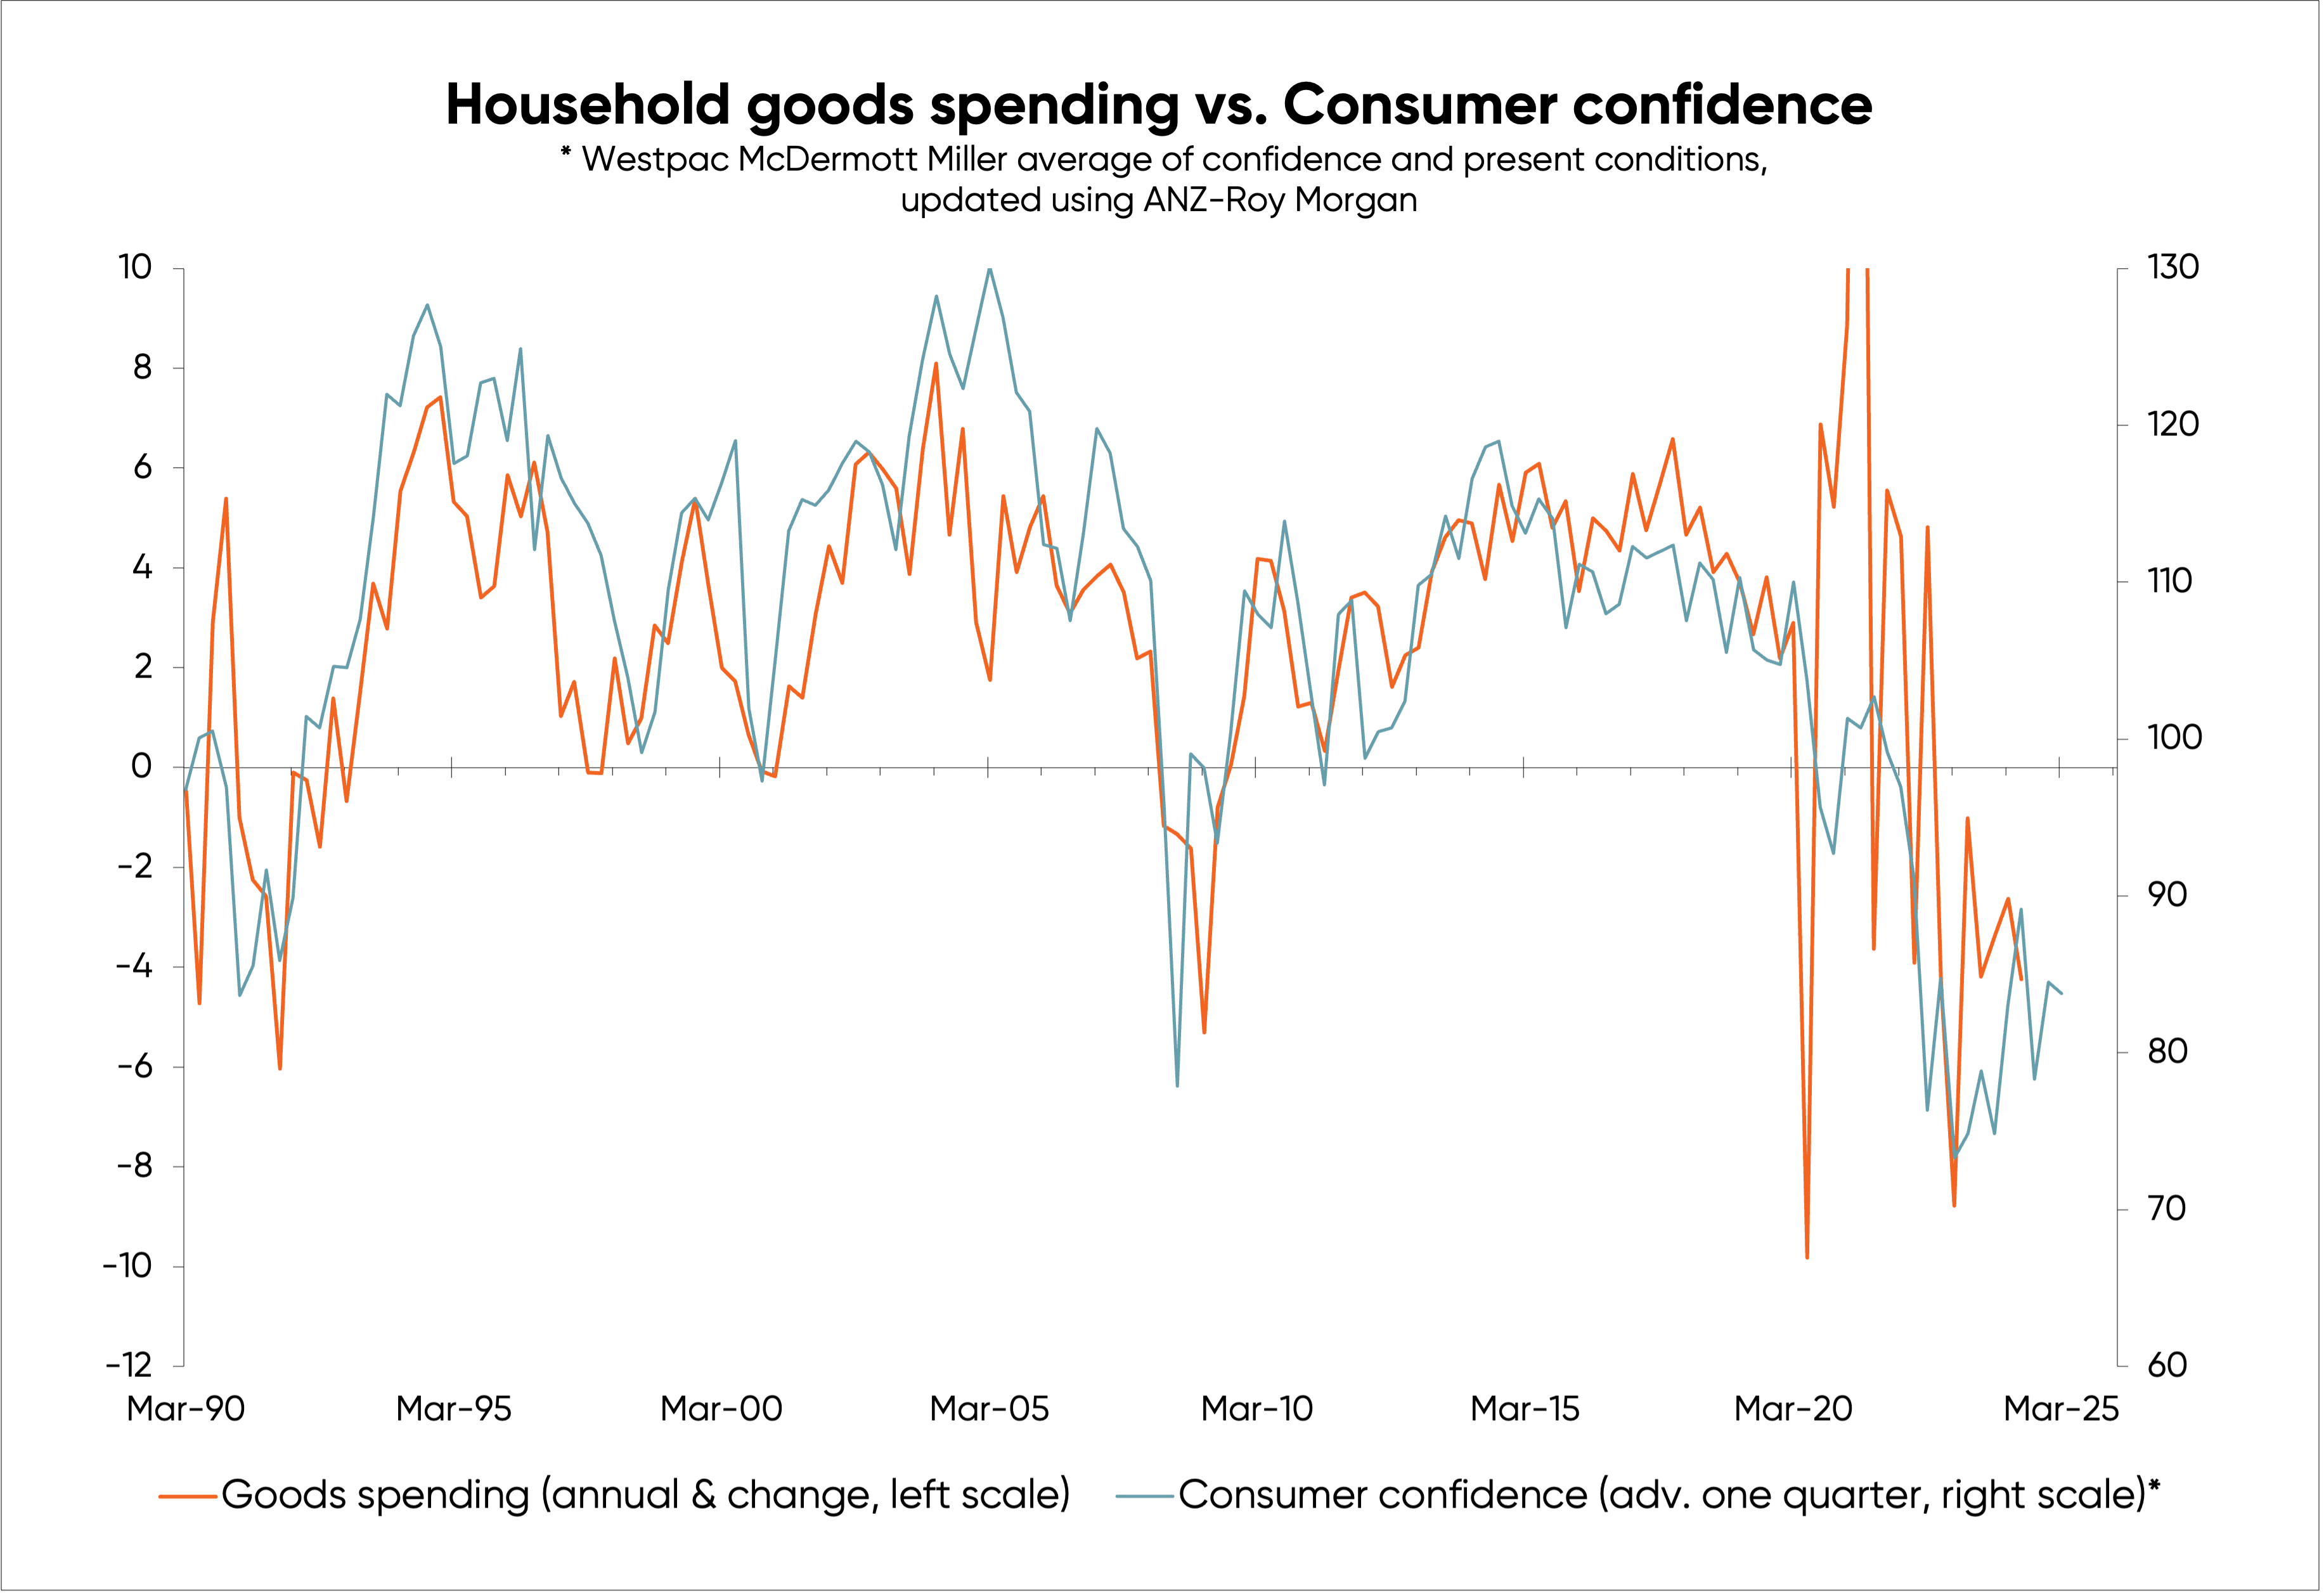
Interestingly, annual growth in household spending on goods has turned negative roughly as the consumer confidence survey predicted—as you can see in the second chart.

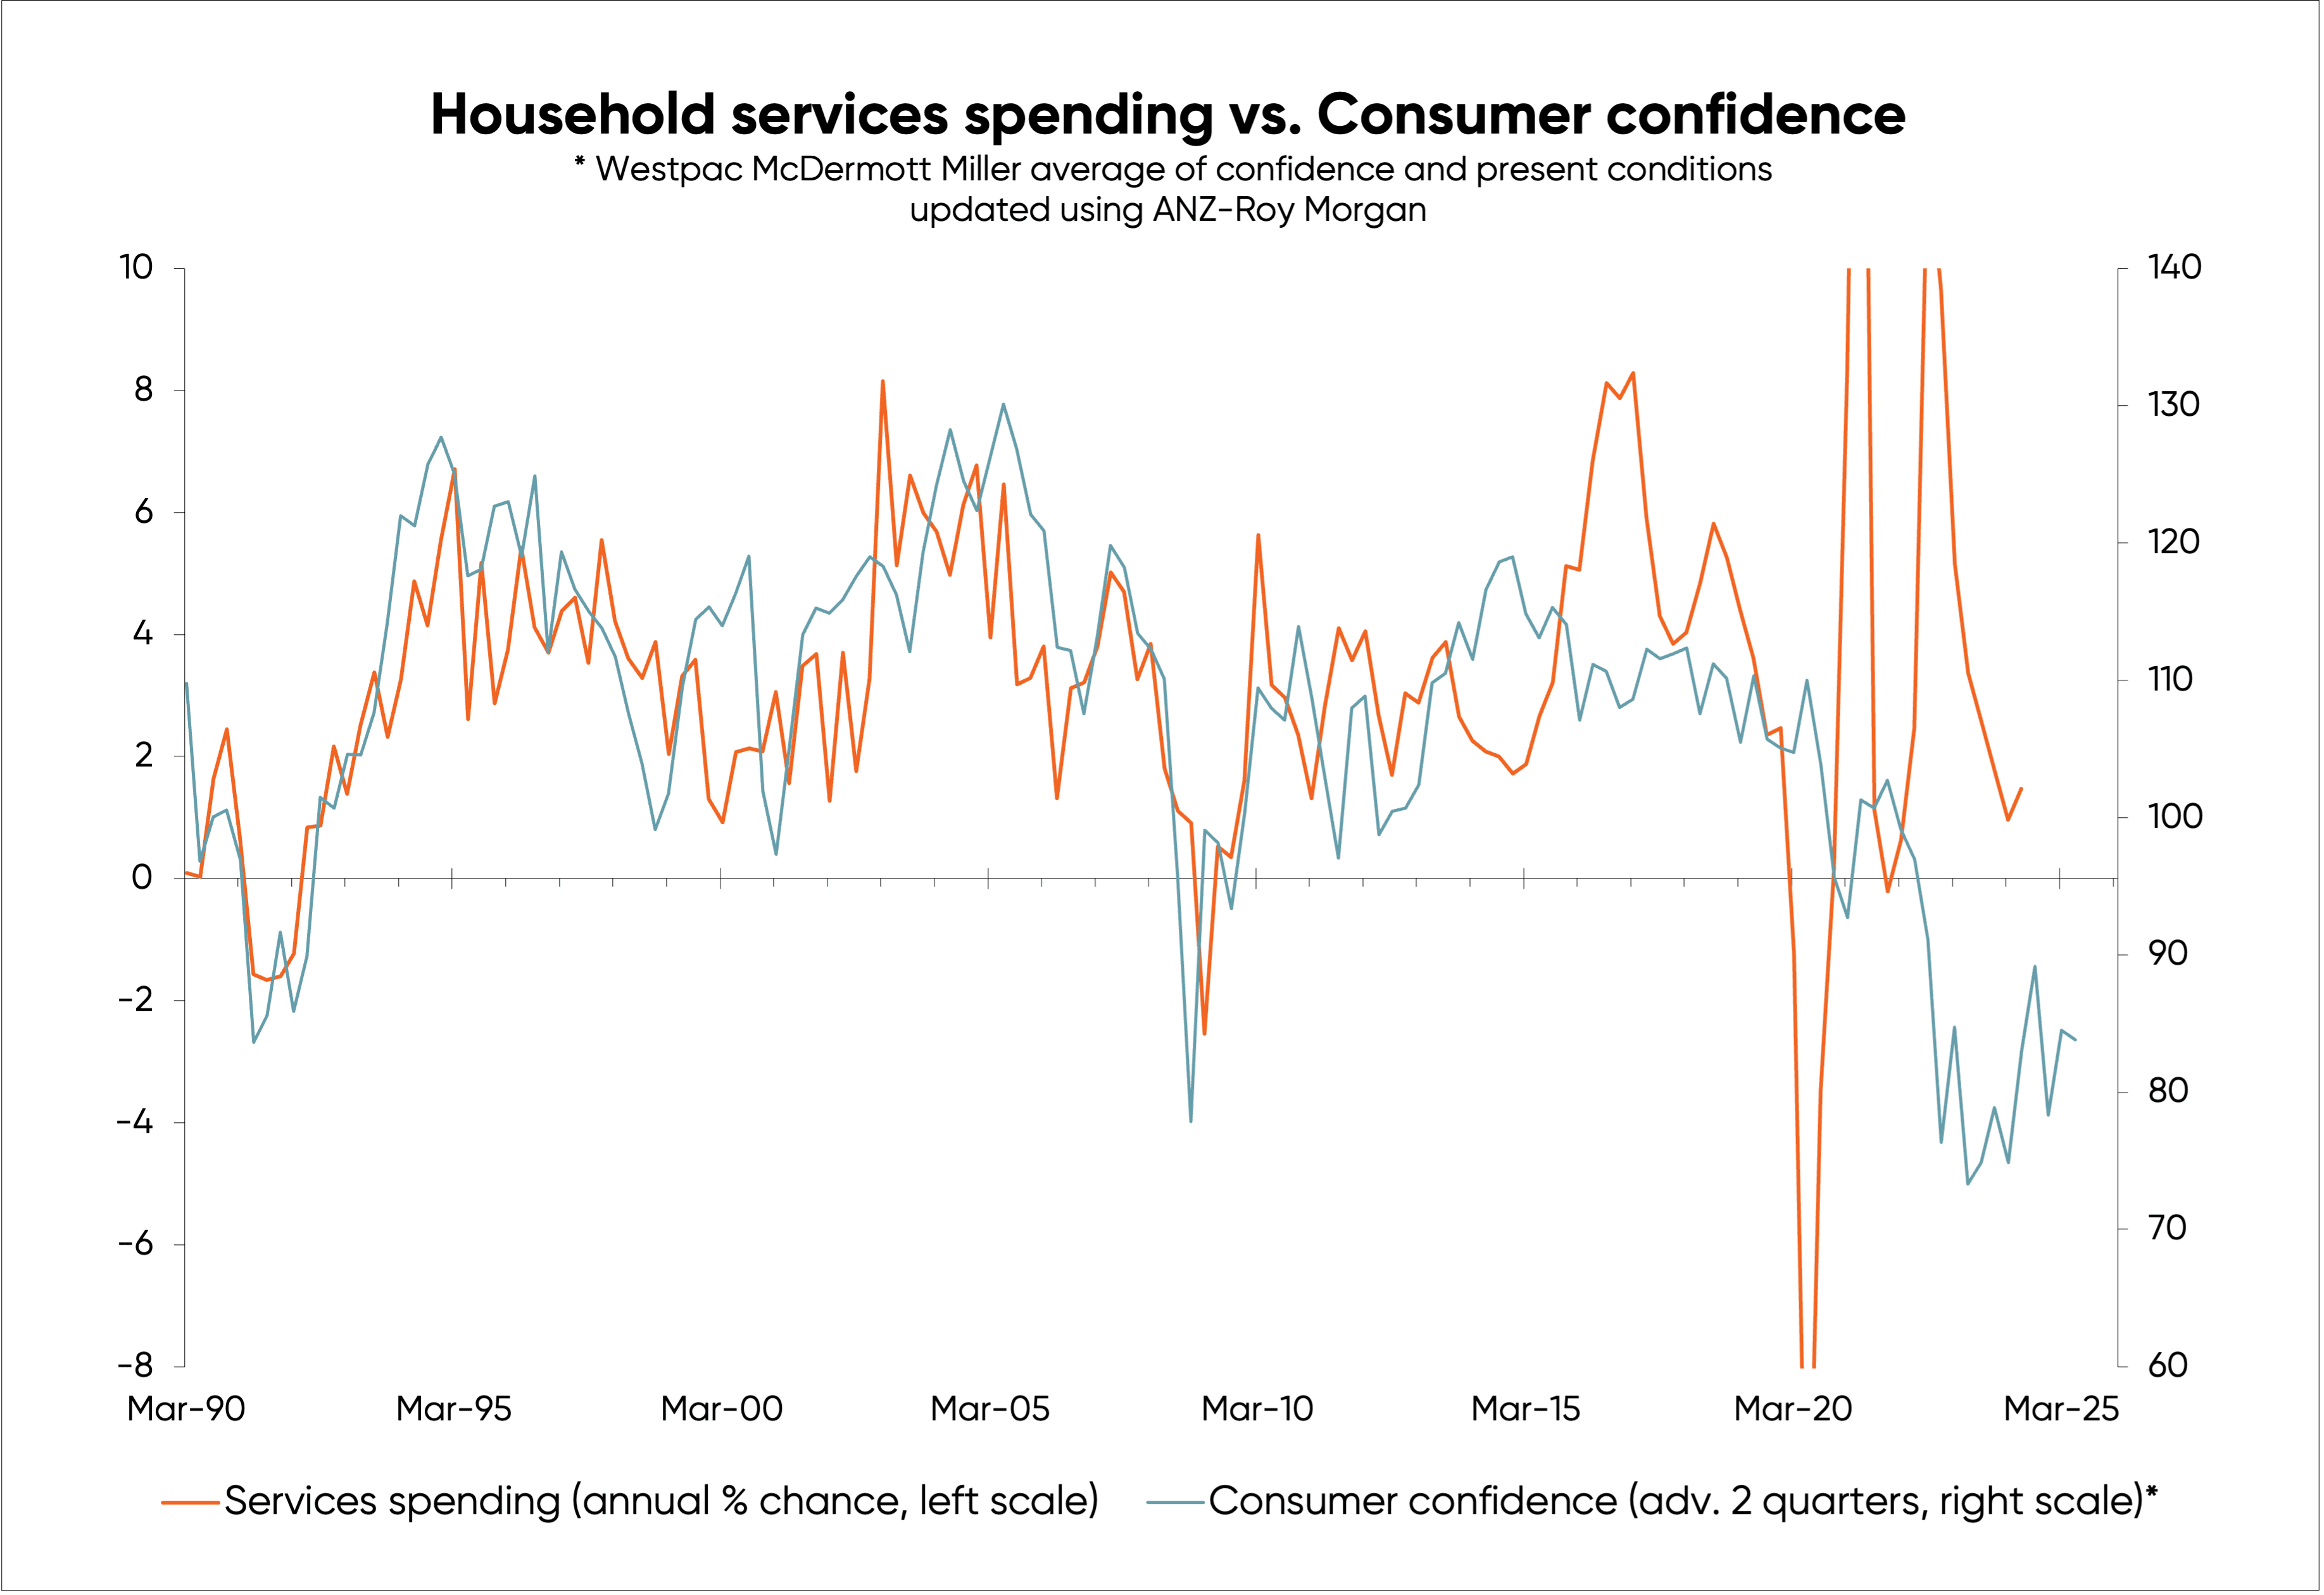
However, annual growth in spending on services remained positive, despite the recessionary consumer survey—as shown in the third chart.

COVID-19 temporarily interrupted the relationship in the charts, but this impact is long gone—leaving me to wonder if there has been a chance or breakdown in how Stats NZ measures services spending.
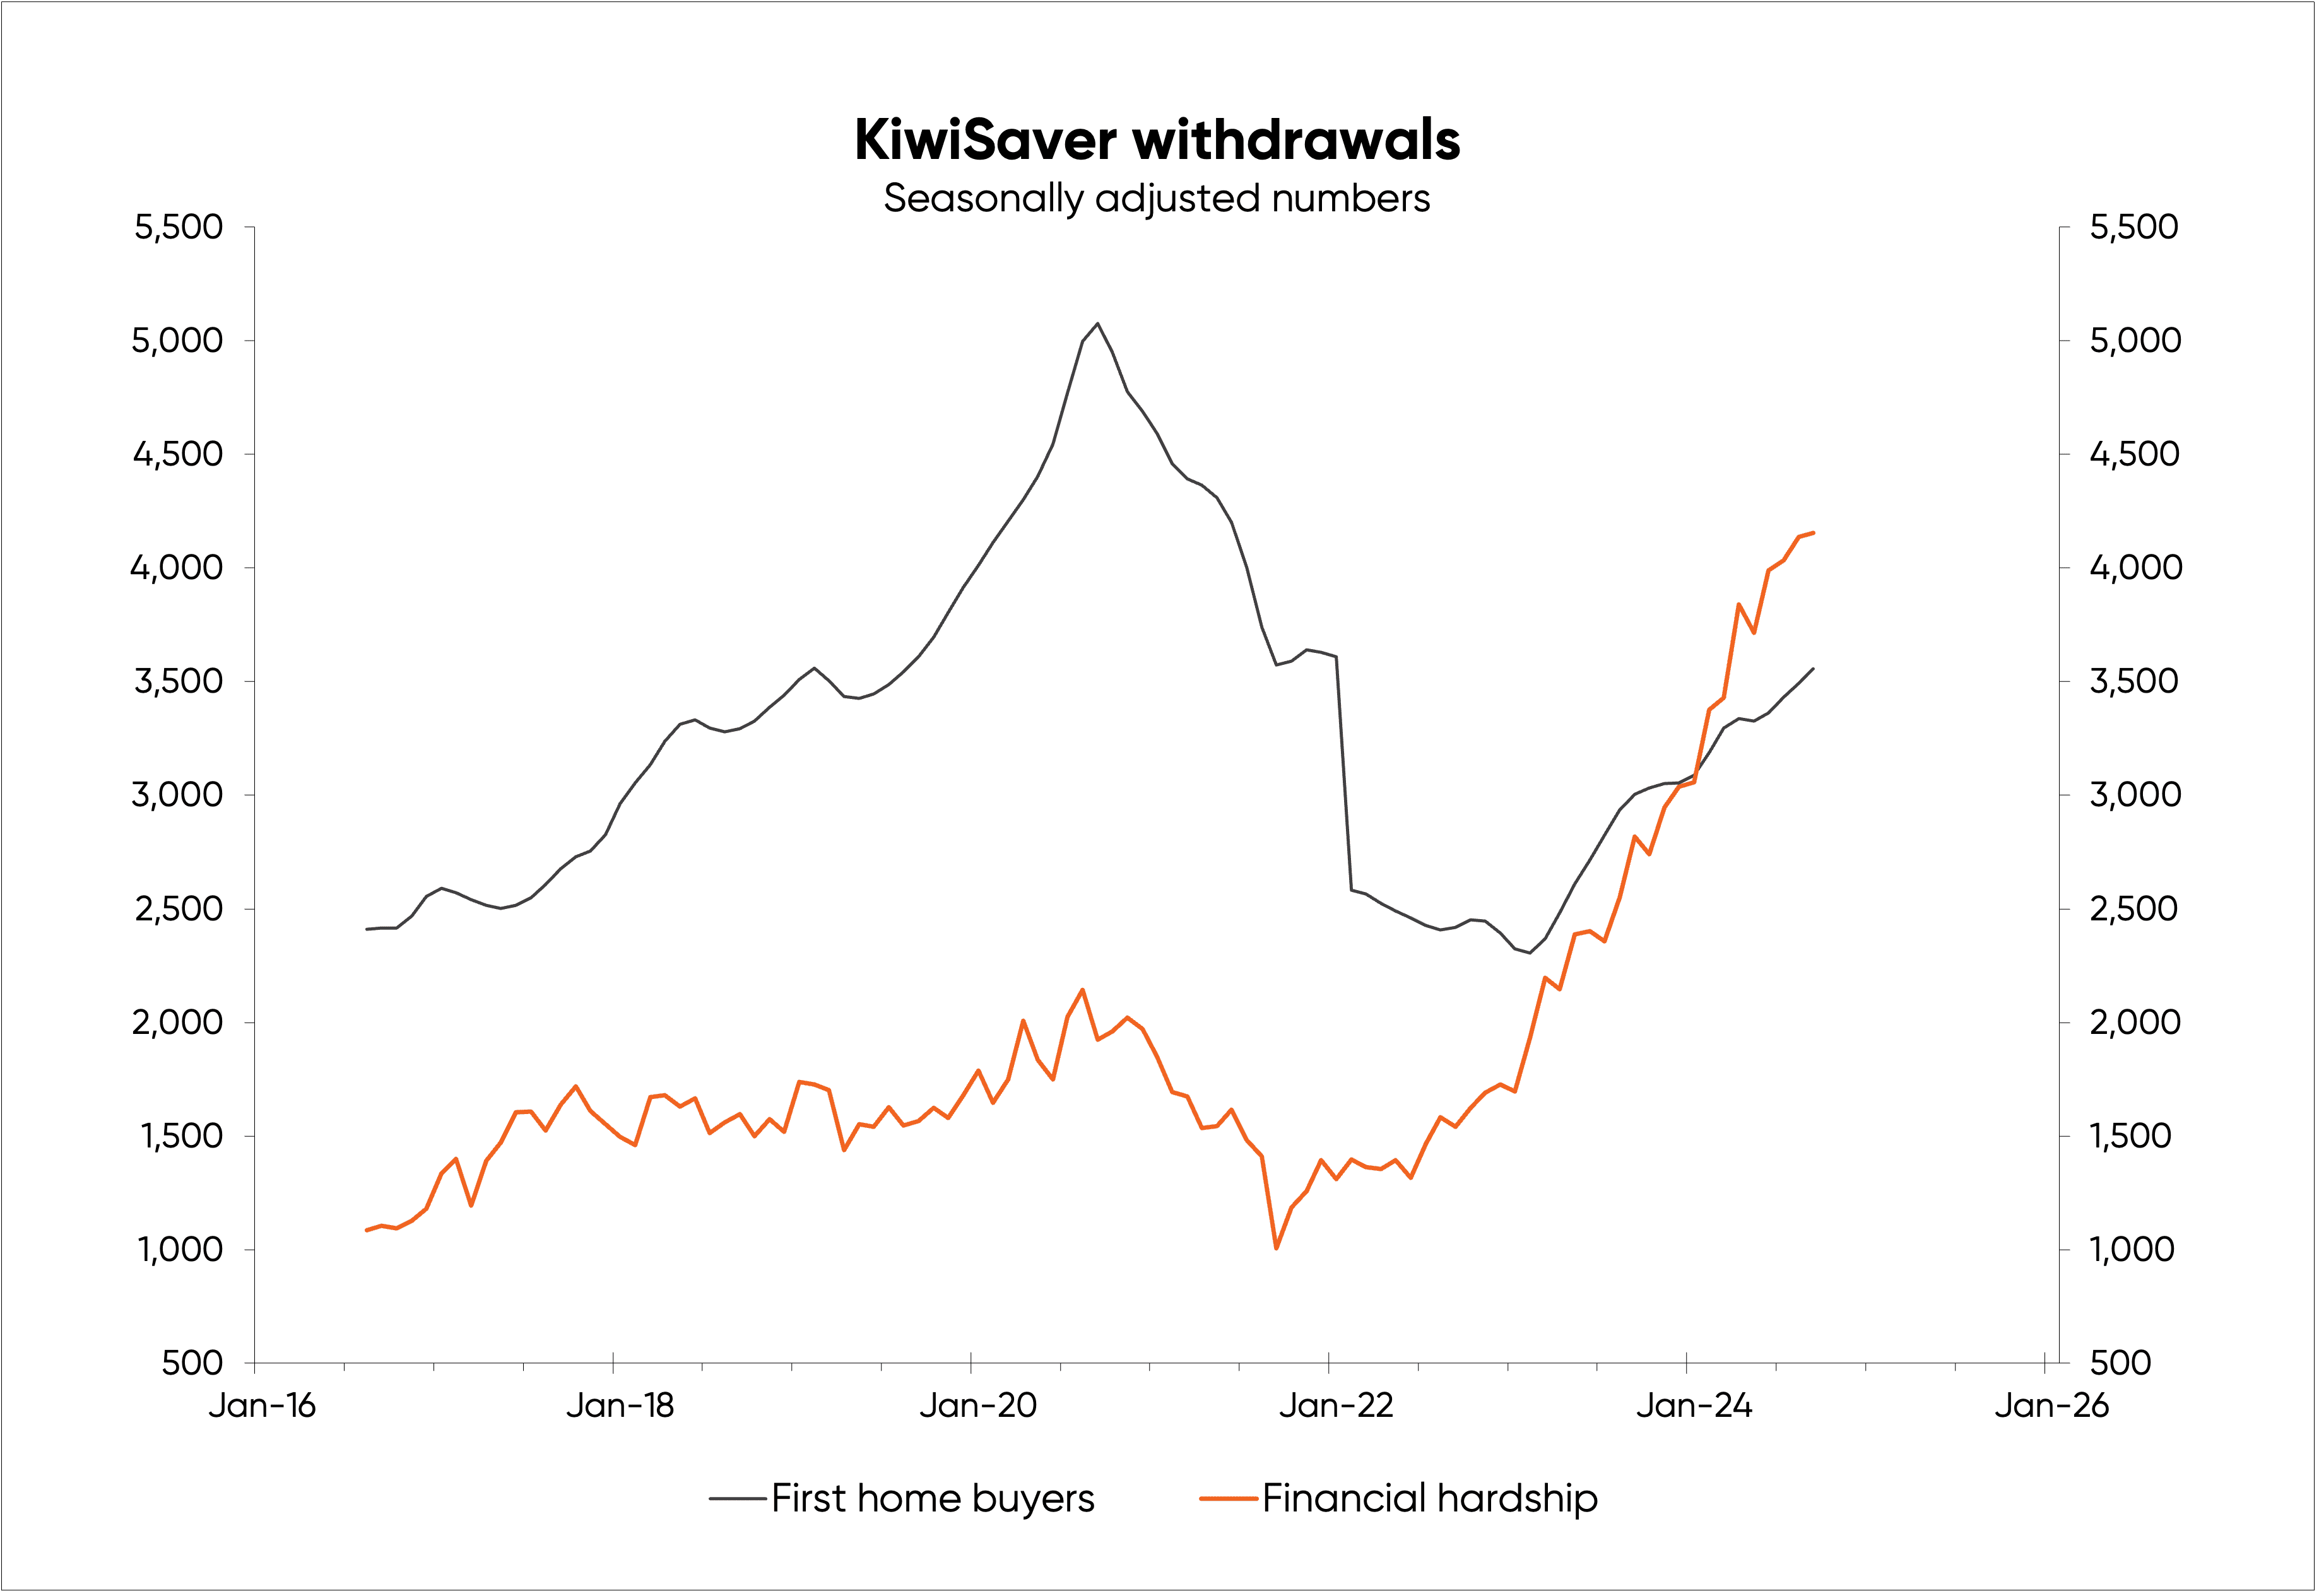
Following the latest hike in interest rate costs, measures of financial stress show many have been forced to curtail spending, and there's been a huge increase in financial hardship withdrawals from KiwiSaver (as shown in the fourth chart).

So, surely people have cut spending on a range of services, just as they did in past recessions?!
Feedback I have from businesses and casual contacts in the service industry says this is certainly the case—but Stats NZ's data says that household spending on services has actually increased. Something isn't right!
How Stats NZ measures household spending on goods and services is outlined on pages 38-40 of the fifth edition of the Sources and Methods booklet.
Measurement of household spending is largely reliant on the retail sales survey—including spending on goods—supplemented by the "selected services survey" which covers just give of the many service categories households may spend on.
Some other sources are used for spending on services, but in some areas annual data (with somewhat vague sources) are used to provide the quarterly estimates.
It seems the basis of the assessment of household spending on services is less reliable than the basis for assessing spending on goods. This doesn't necessarily mean Stats NZ's measurement of services spending is wrong, but it increases the potential for estimation errors.
Stats NZ has, itself, been under financial stress, and in the past has made some poor judgements. For example, upon discovering it had excluded two groups of employees in the Household Labour Force Survey, it added them in one quarter without back-dating the data, resulting in a huge, erroneous jump in official employment numbers.
The less reliable sources for estimating spending on services, and the possibly poor decisions have been made when constructing the estimates, increases the likelihood of inaccuracy in Stats NZ's estimates of household spending.
By Rodney Dickens, Managing Director, Strategic Risk Analysis Ltd www.sra.co.nz.
