It’s convenient and lazy to show that for the past thirty years house prices have doubled every ten years, and even worse to extrapolate it out into the future. For those of you that like a few numbers, strap in as you’re about to exercise your brain, but I promise it’s worthwhile.
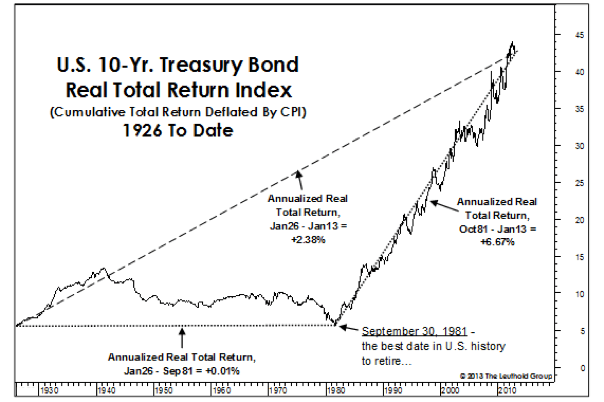
Take a look at the graph below showing the return on US 10 Year Treasury Bonds since the 1930s. Similar to property the tipping point is 1981. Since then, bond prices have risen giving a total inflation adjusted fixed interest return of 6.67%.

That’s similar to the capital growth on property and highlights the strong correlation between interest rates and asset prices.
Basically, as interest rates decrease, asset prices go up. Let’s use this formula and apply it to housing.
Property prices (and any asset value for that matter) are a function of cash flow discounted to a current value. The same formula can be applied to share prices and in its simplest guise is referred to as a price to earnings ratio (PE ratio.)
| Price = eCF / (dR - gR) |
||
| Expected cash flow | eCF | The net rent on the property. It is influenced by rent but also by costs like rates and insurance and maintenance. It would also include tax treatment of losses. |
| Discount rate | dR | This is what we might consider the neutral mortgage interest rate through an economic cycle. |
| Growth rate | gR | This is the cash flow growth rate. Broadly we should think of it as income growth because clearly long terms rents cannot increase faster than incomes. |
Ok so let’s apply the model.
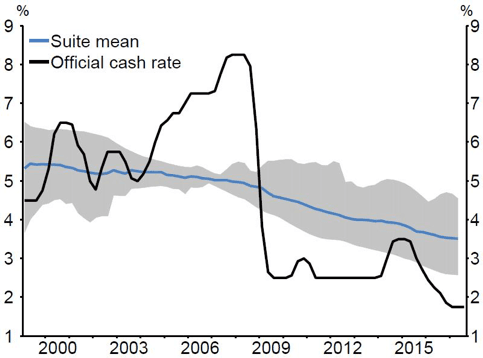
The reduction in the neutral interest rate is important for our model. The graph below shows the RBNZ view of a neutral official cash rate which has fallen from around 5.00% in the early 2000’s to 3.50% now.
That implies neutral mortgage rates have fallen from around 7.00% to 5.50% over the same timeframe.

The next factor in our valuation model is the long run growth rate.
For that I’ve used per capita GDP growth as reflecting income growth. I’m assuming that hasn’t changed, but it could change. If you applied our model below the NZ level, growth rates in Auckland have been stronger than other parts of the country.
| Year | Rent | Neutral rate | Growth rate | Price index | House price index (Auckland) |
| 1988 | $100 | 12.00% | 6.00% | 100 | 100 |
| 2008 | $241 | 7.00% | 2.50% | 322 | 406 |
| 2018 | $375 | 5.50% | 2.50% | 749 | 749 |
*For 1988 I’ve estimated these numbers as couldn’t find reliable data points.
This model is by no means perfect. The price index is the model output indexed to 1980 and I’ve done the same for house prices. The model shows that a drop in the neutral interest rate can explain all of the change in house prices over the past 30 years.
The same is true of the share market and also true of bond markets. This is not unique to property.
If the model holds true, then what will drive up house values in the future?
Rents will continue to increase at around 2.50% per year and that will gradually lift house prices but only at up to 2.50% per year. Equally, in the short term, increasing costs like rates, insurance, and tax treatment could reduce cash flows and therefore drop values.
Neutral rates are unlikely to decrease, but there is still the possibility. After all, there is no inflation. If rates did fall further, then house prices would increase.
What about applying the model to a micro market? The neutral rate is a NZ wide factor, whereas the growth rate can be influenced by micro factors like gentrification. Some areas will experience higher income growth and that will translate into house price growth.
My conclusions are (1) broadly speaking capital growth is dying which sucks if you have a yield of 3% with ring-fenced losses and (2) investing requires more analysis and identifying the areas with above average income growth.
Talk to one of our mortgage brokers NZ for further information regarding changing house prices. If you're looking to buy your first property, our advisers can tell you everything you need to know as a first home buyer. With our mortgage calculator, you can estimate how much you can borrow for a house, and what your repayments would be.
