
Over the last few months, electronic card spending data from Statistics NZ—derived from EFTPOS transactions—has painted a picture of Kiwi households struggling financially.
Card spending in May 2025 was down 2.3% from that reported for December 2024 (after adjusting for seasonal behaviour) and 3.7% below the peak level in April 2023, as shown in the first chart, below.
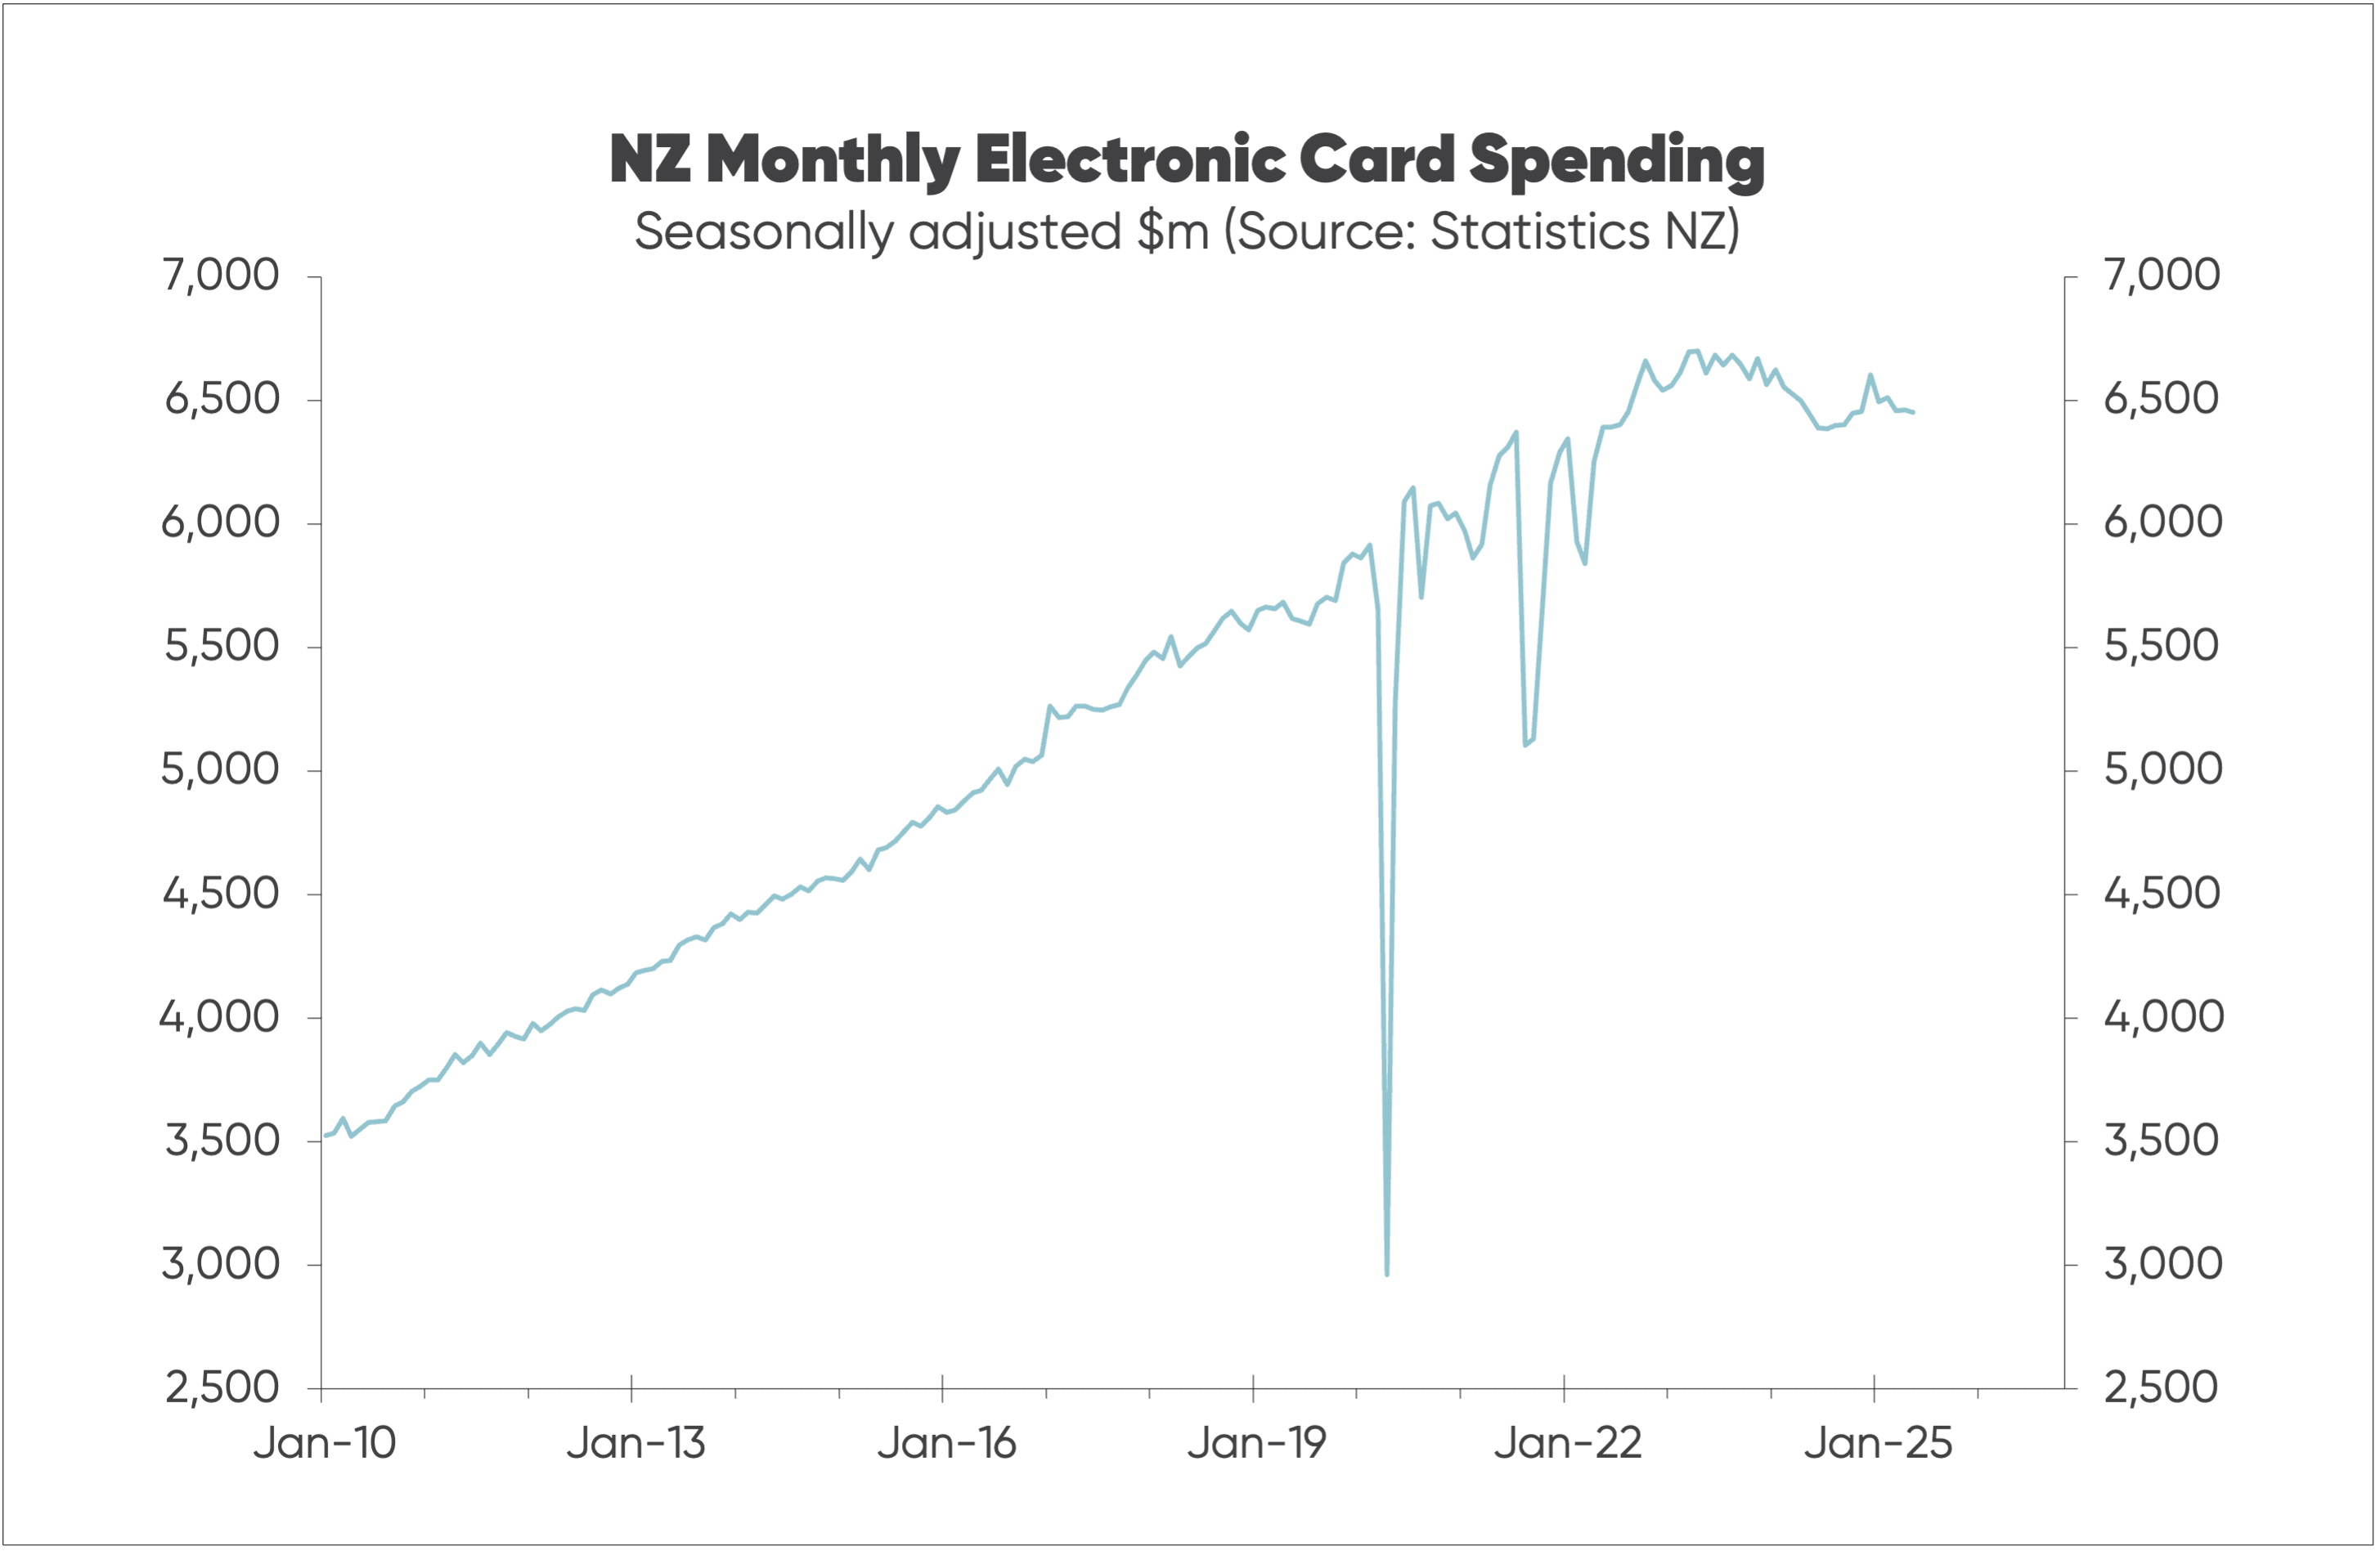
Taken at face value, this suggests the recession may have returned.
Monthly card spending data gets quite a bit of press compared to quarterly GDP data—the latter of which includes a breakdown of household spending on durable goods, non-durable goods, services and overseas online spending by households on lower valued goods.
Household spending on services includes housing (rent or mortgage payments, council rates, and utilities), transportation (including vehicle maintenance, public transport, and fuel), healthcare (medical services, insurance), leisure activities (entertainment, dining out, and hobbies), education, financial services, and various miscellaneous services.
The problem is that card spending data has become a poor indicator of total household spending—because it relates most closely to the purchase of goods.
Stats NZ’s estimate of household spending on goods (durable and non-durable) remains a bit below the 2023 peak level – blue line in the second chart – consistent with the card spending data.
However, household spending on services has risen strongly (orange line).
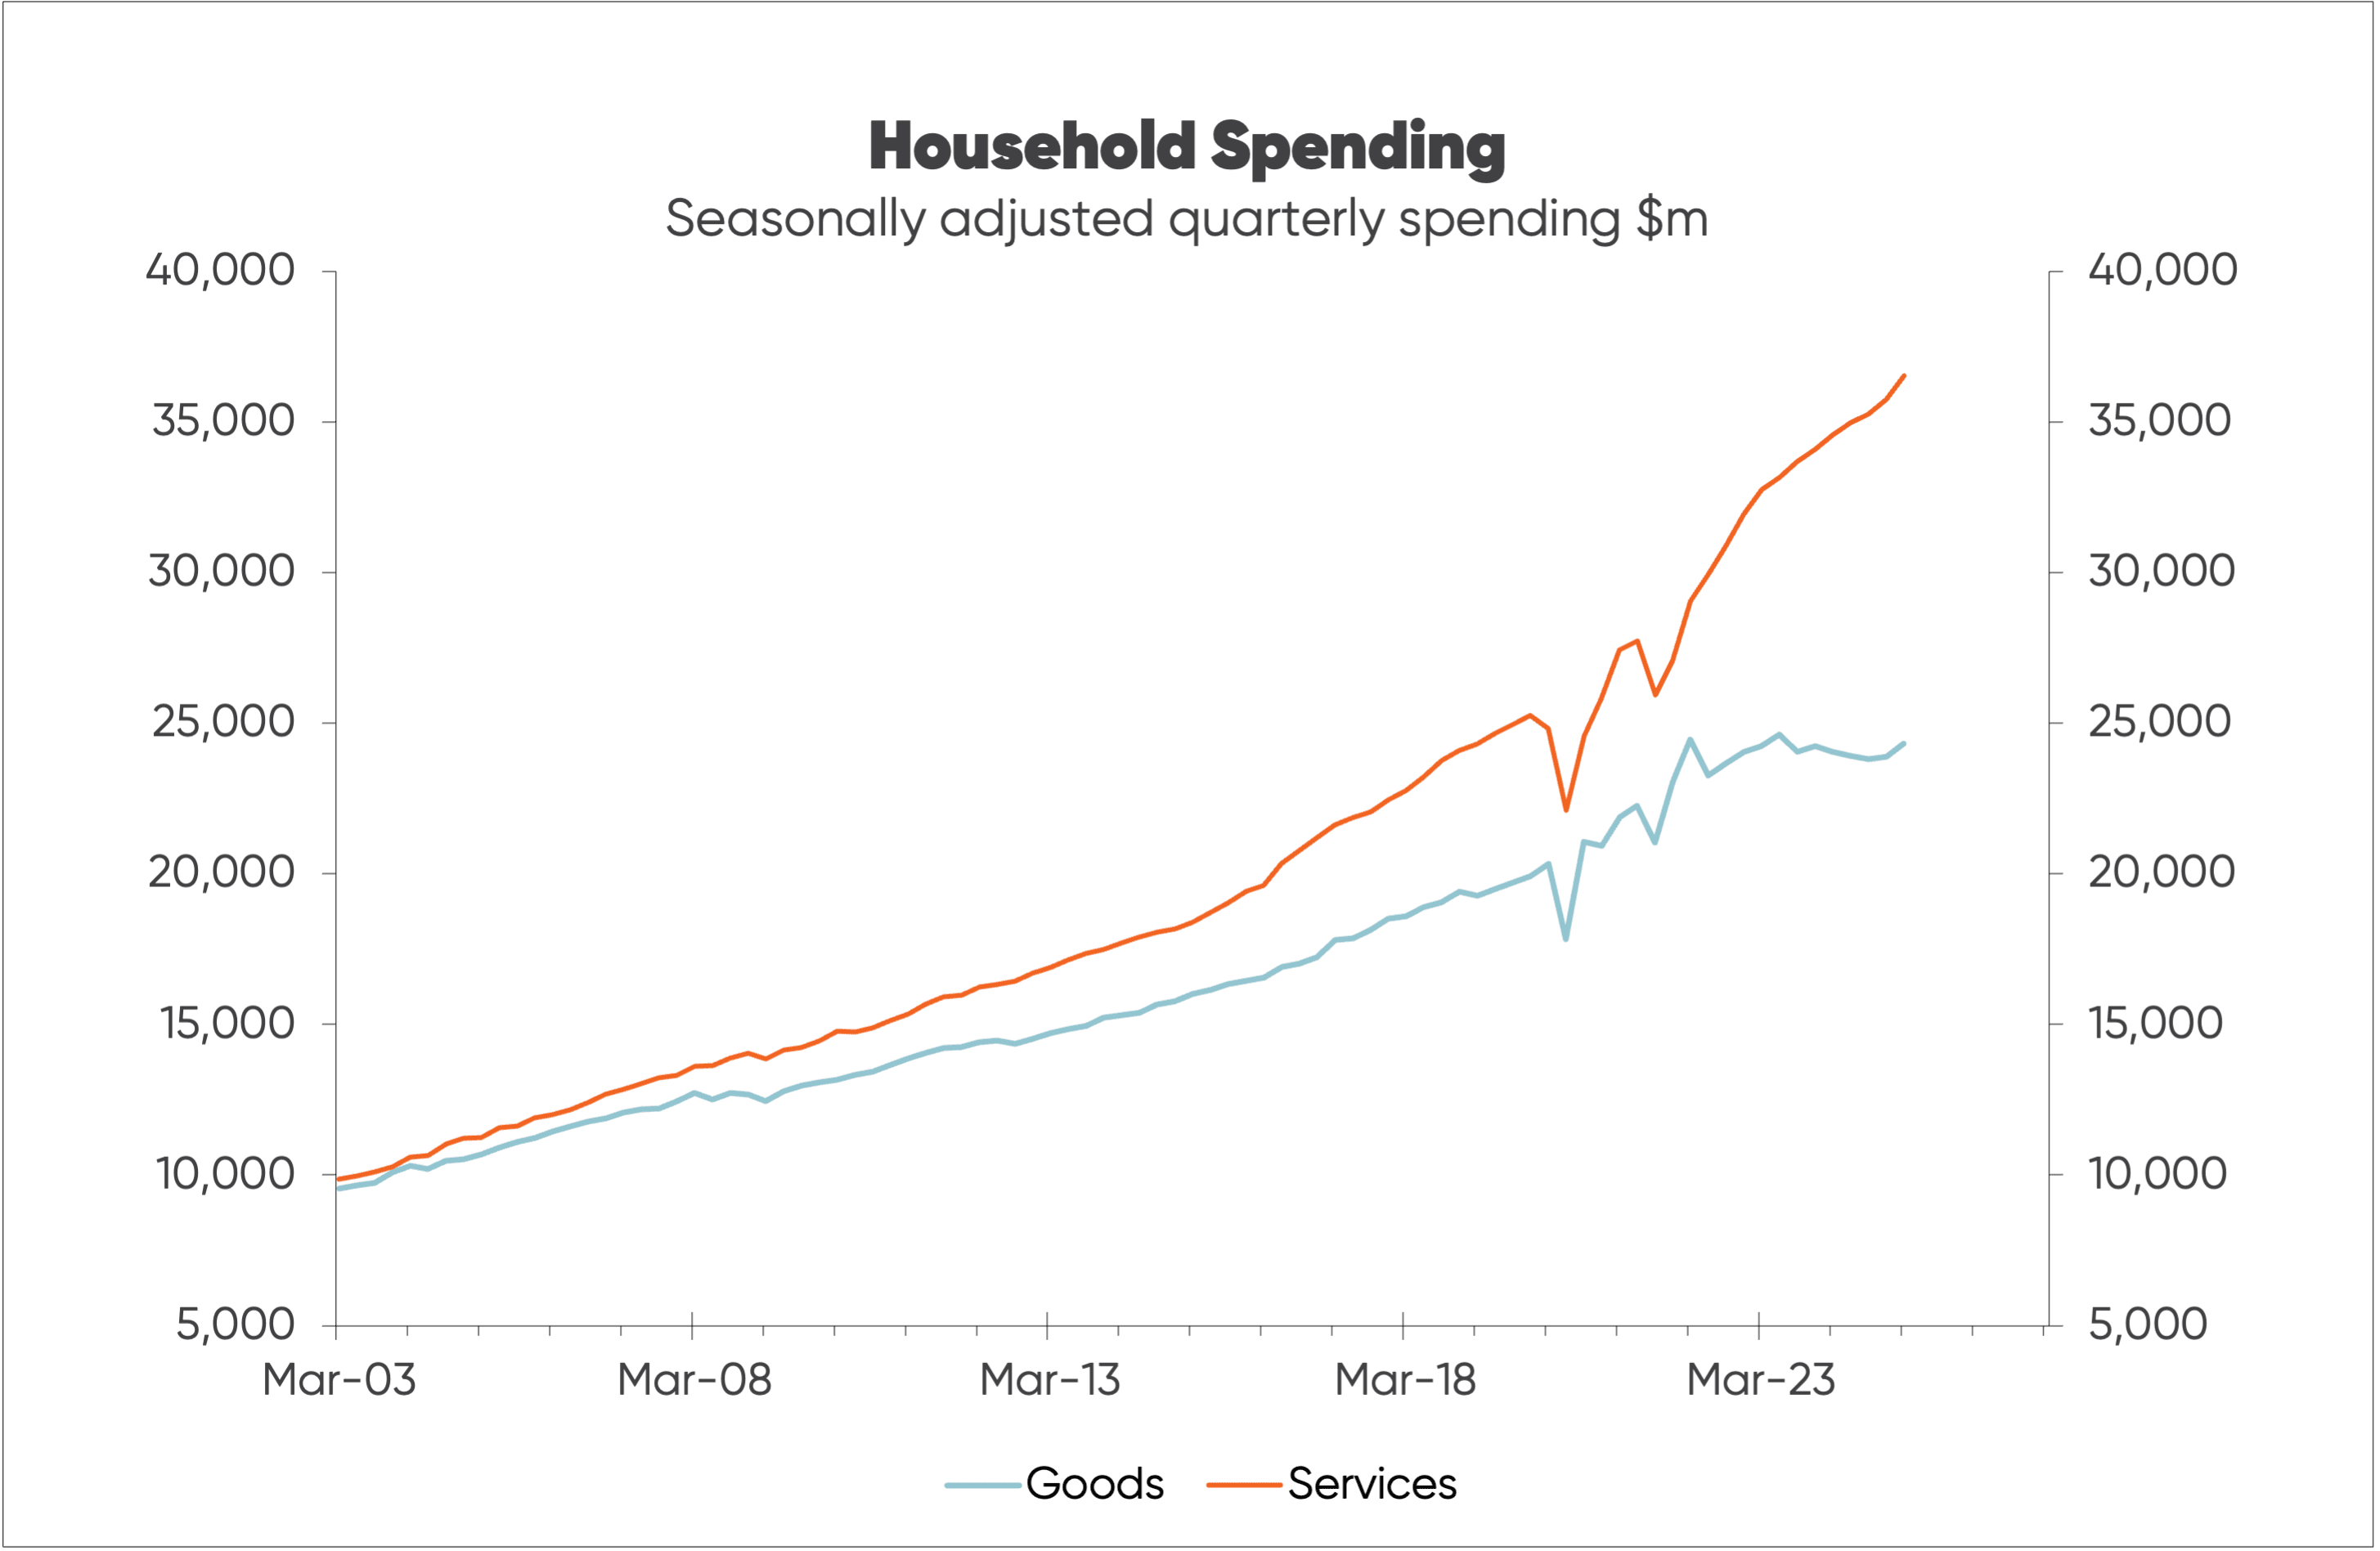
Since the 2022 March quarter, household spending on services has increased 26% while spending on goods fell by 0.6%.
The second chart shows that the evolution away from spending on goods to spending on services started well before 2022, with spending on services now 50% higher than spending on goods whereas in 2003 the two were similar.
Household spending data is released only quarterly as part of the GDP data release versus the monthly release of card spending data. Consequently, the card spending data get much more media coverage leading to a misleading impression of spending by households and their financial situation.
A 2013 research report by MOTU – an independent economic and public policy research organisation - showed card spending data to be a useful indicator of consumer spending and GDP.
However, changes in household spending habits—particularly since 2022, although starting much earlier—have greatly undermined the usefulness of card spending data. Most economic commentators have yet to catch on to this and still put too much weight on the insights provided by the card spending data.
There are still many retailers struggling with spending, especially on durable goods, which has been hurt more than other household spending during recessions. This was the case with the 2024 recession and spending on durable goods remains well below the pre-recession level.
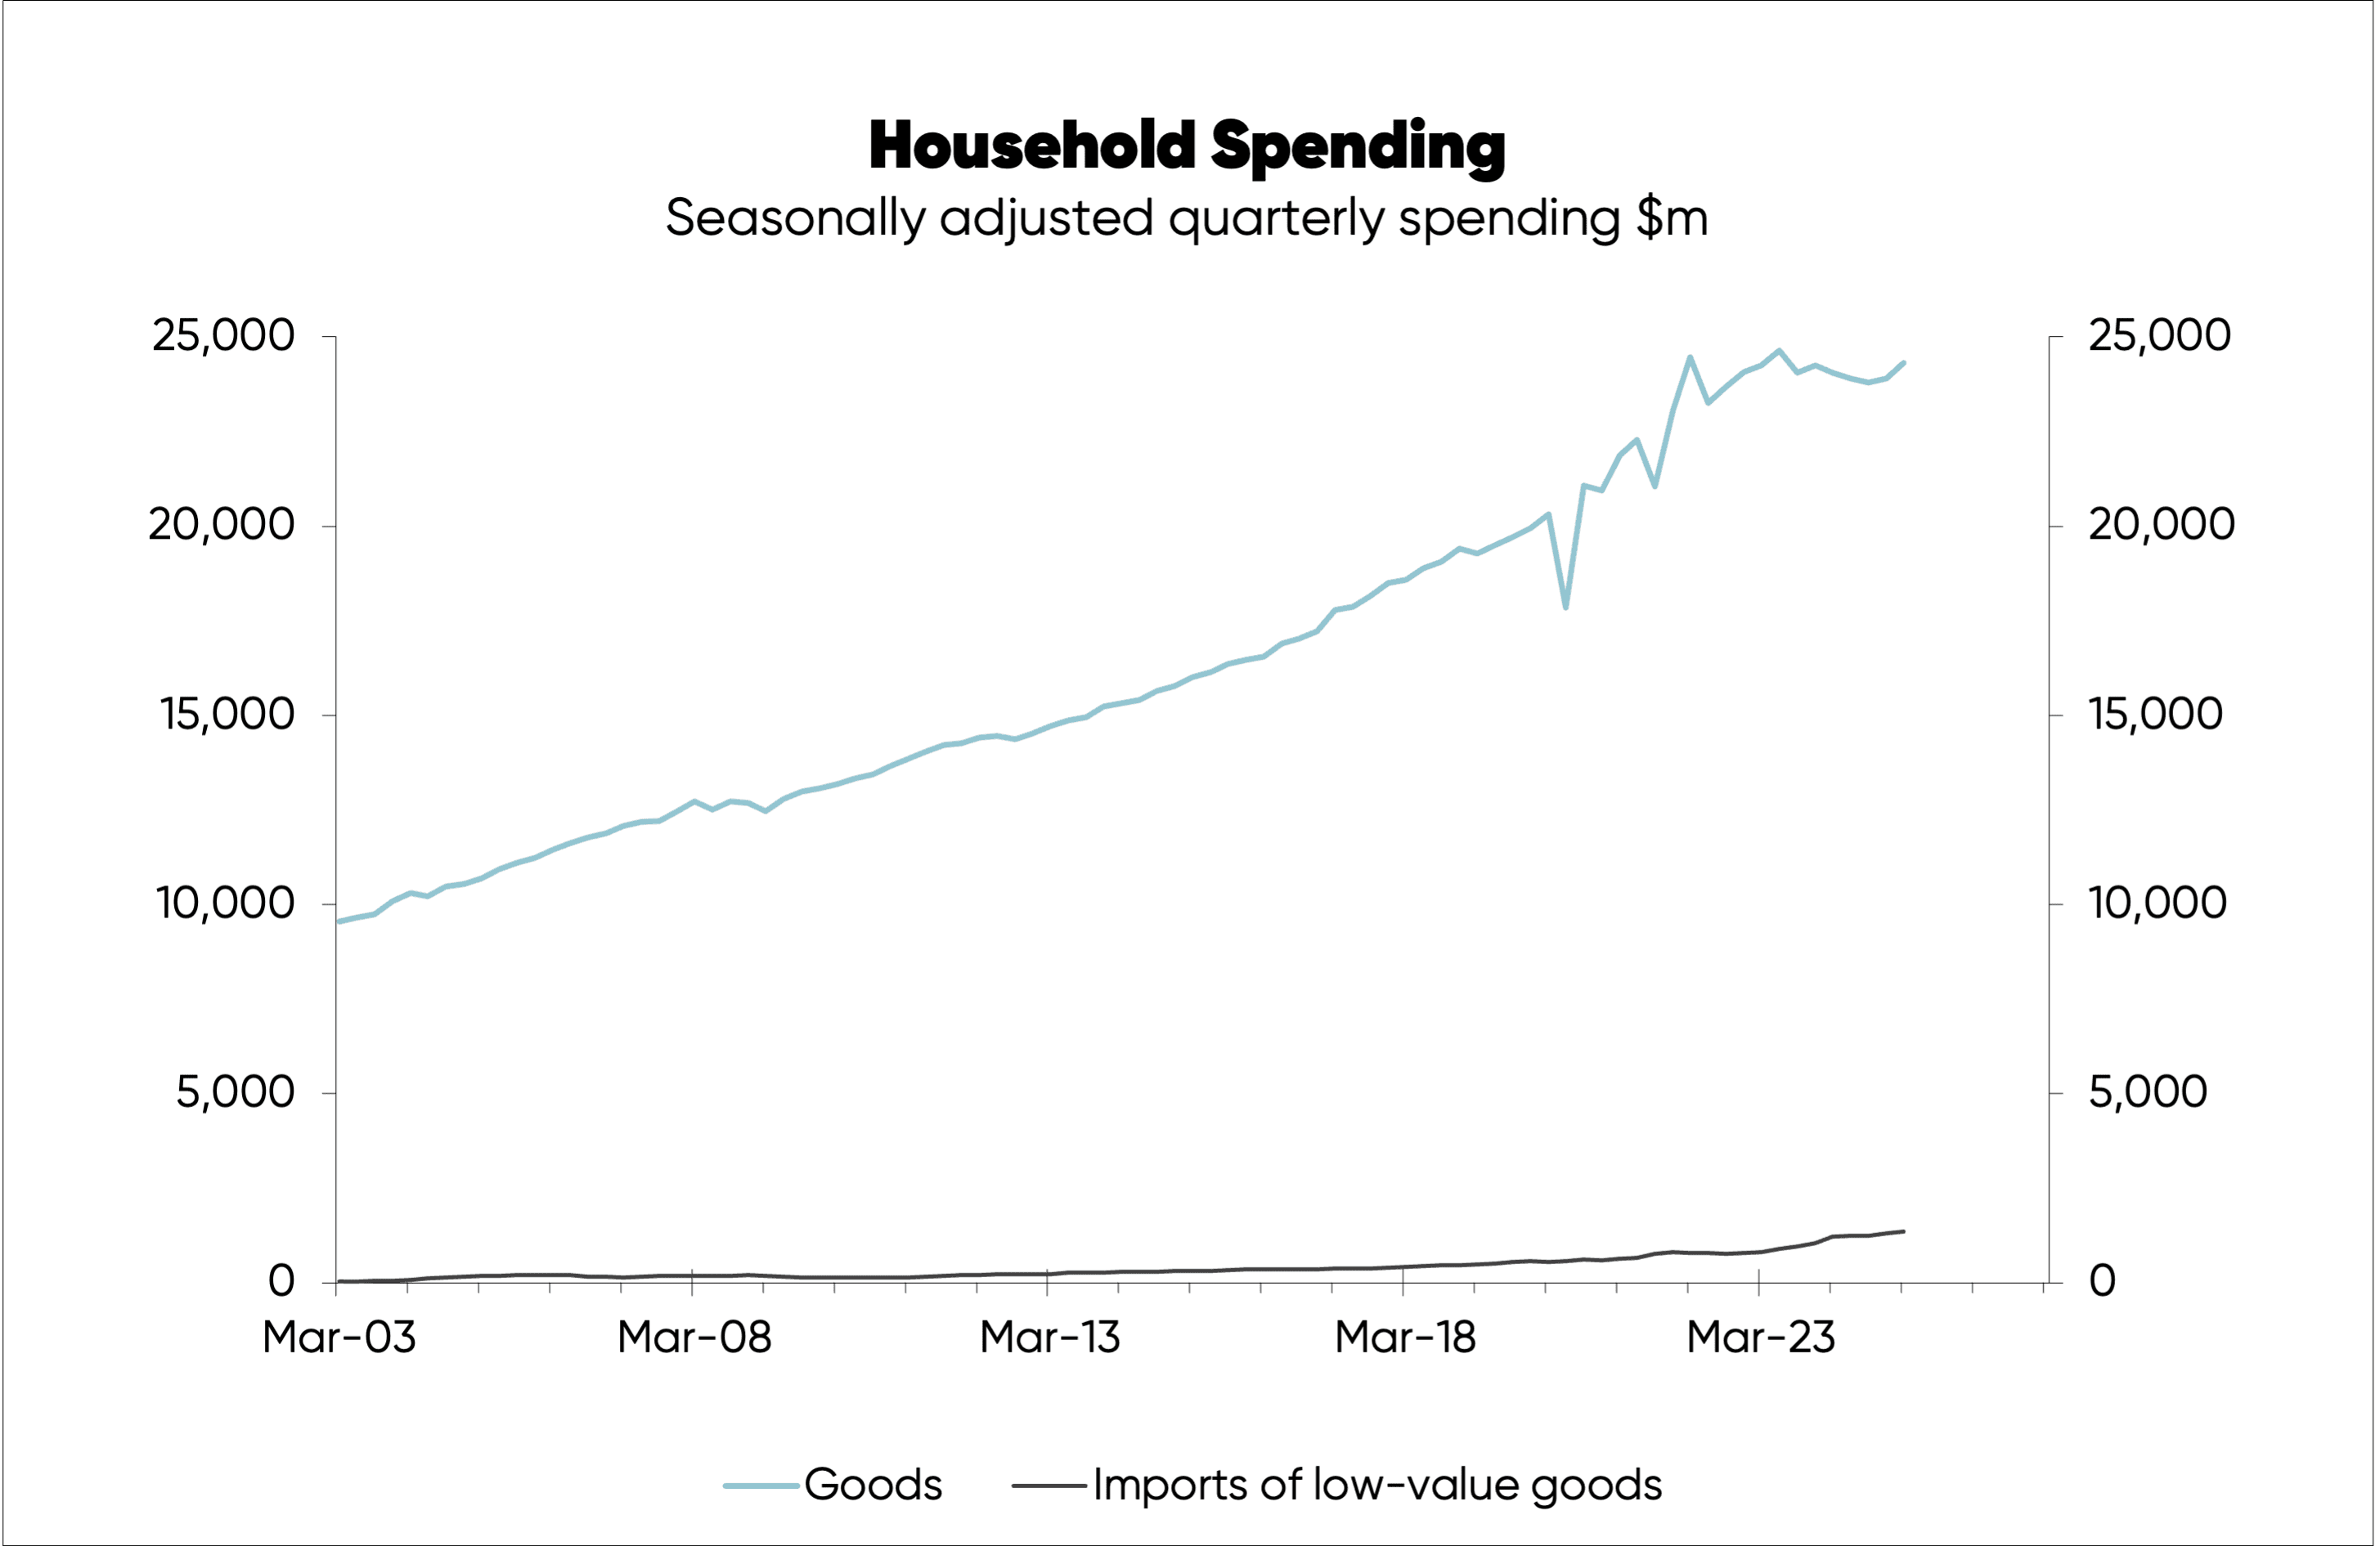
Retailers are also being impacted by strong growth in household spending on imported smaller items, which has doubled since 2021 based on Stats NZ’s quarterly estimates versus only 9% growth in household spending on goods (durable and non-durable) as shown in the third chart.
Things should improve for retailers as the economic recovery unfolds. But my key message is that card spending and retail sales data—which gets quite a bit of attention from economists— have understated household spending by quite a wide margin in recent years (and is likely to continue to do so).
By Rodney Dickens, Managing Director, Strategic Risk Analysis Ltd www.sra.co.nz.