Numbers of existing dwelling sales have started to rise in recent weeks, following the news that interest rates are now officially on the way down again.
However, there are still some parts of the economy that have yet to experience the full pain of the Reserve Bank’s (RBNZ) overkill in battling inflation. This means underlying price inflation will keep falling until late-2026, making a case for a continued fall in interest rates that will start to help spread the recovery around the economy.
Just as the existing housing market was the first part of the economy to really feel the hurt of rapid rate hikes, it is now among the first to benefit from falling interest rates.
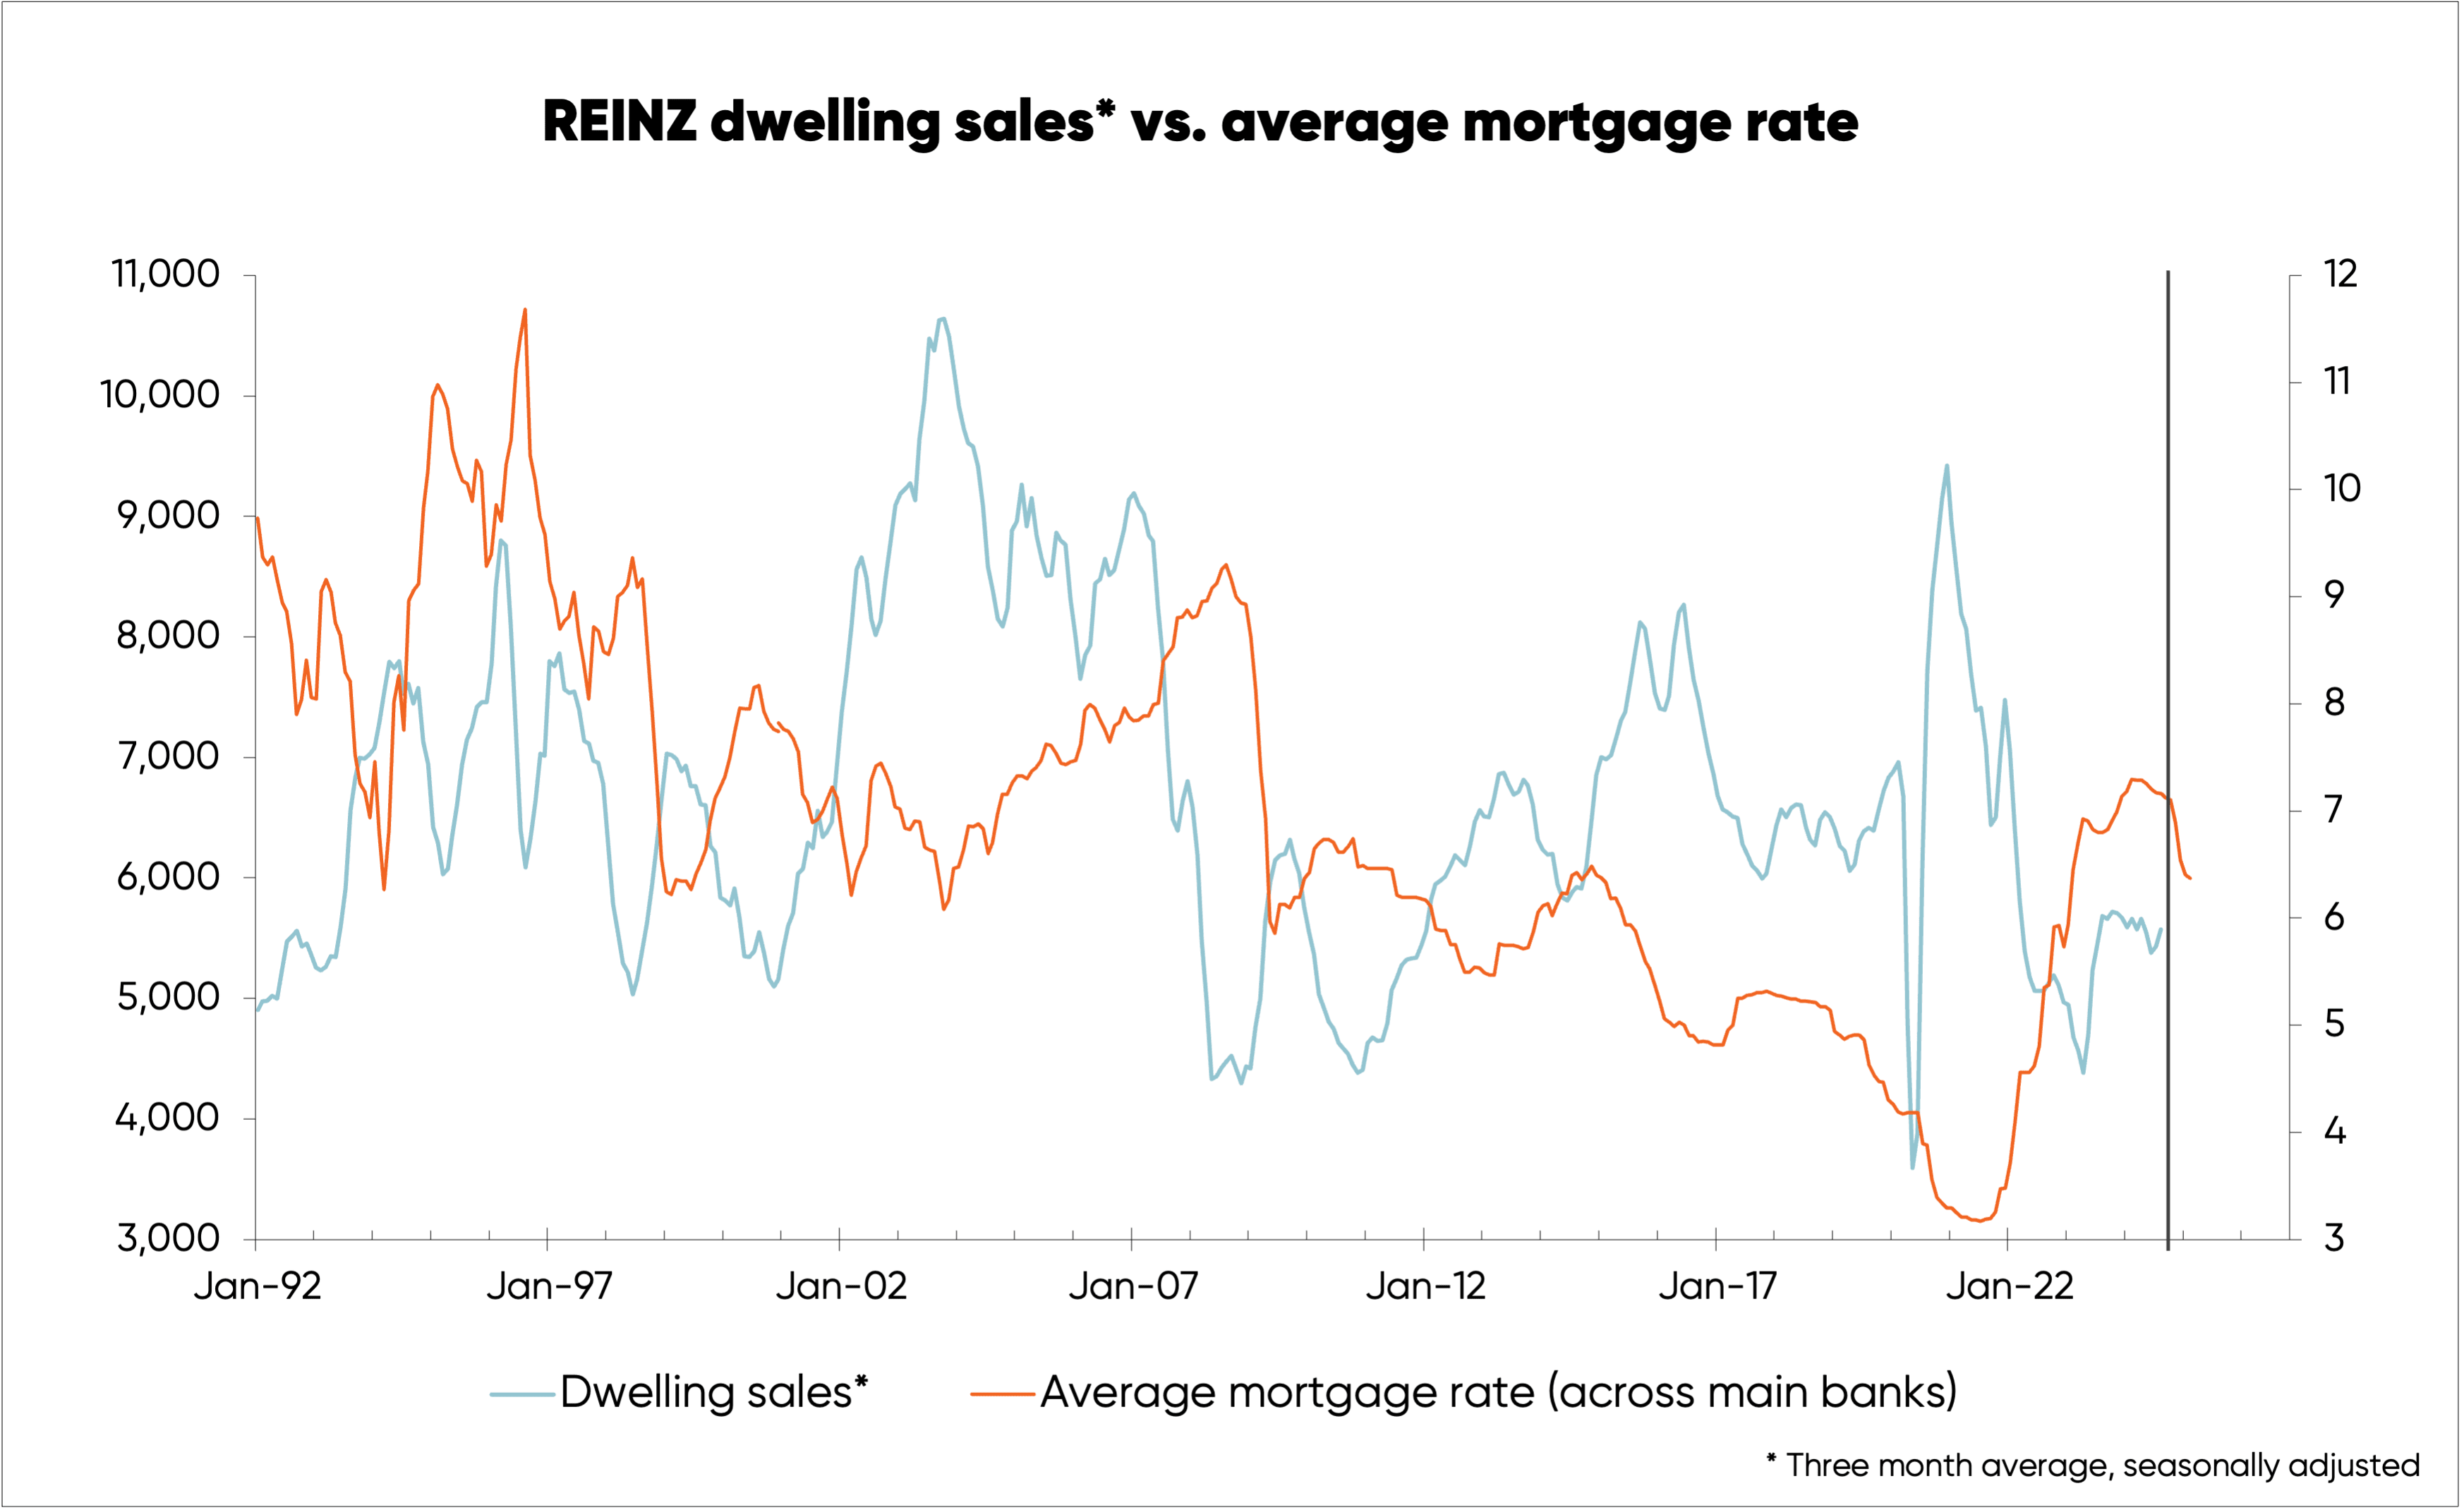
The first chart, below, shows the average mortgage rate offered by the major banks (leading or advanced by four months), relative to three-month average dwelling sales reported by REINZ (seasonally adjusted). The stimulus from the initial fall in interest rates should be starting to boost sales.

REINZ sales numbers are only available up to August, but—as an indication—Barfoot & Thompson’s September sales numbers for Auckland have risen 13% over the last two months (seasonally adjusted).
Rising dwelling sales will start to chip away at the levels of stock listed for sale, but listings are still elevated relative to sales. This means the downward pressure on house prices isn’t over. But as sales rise more, listing numbers will fall, and the demand-supply balance will improve to the extent the fall in prices should end by early-2025.
Some parts of the economy, and especially parts of capital expenditure, have yet to feel the full brunt of this last round of interest rate increases.
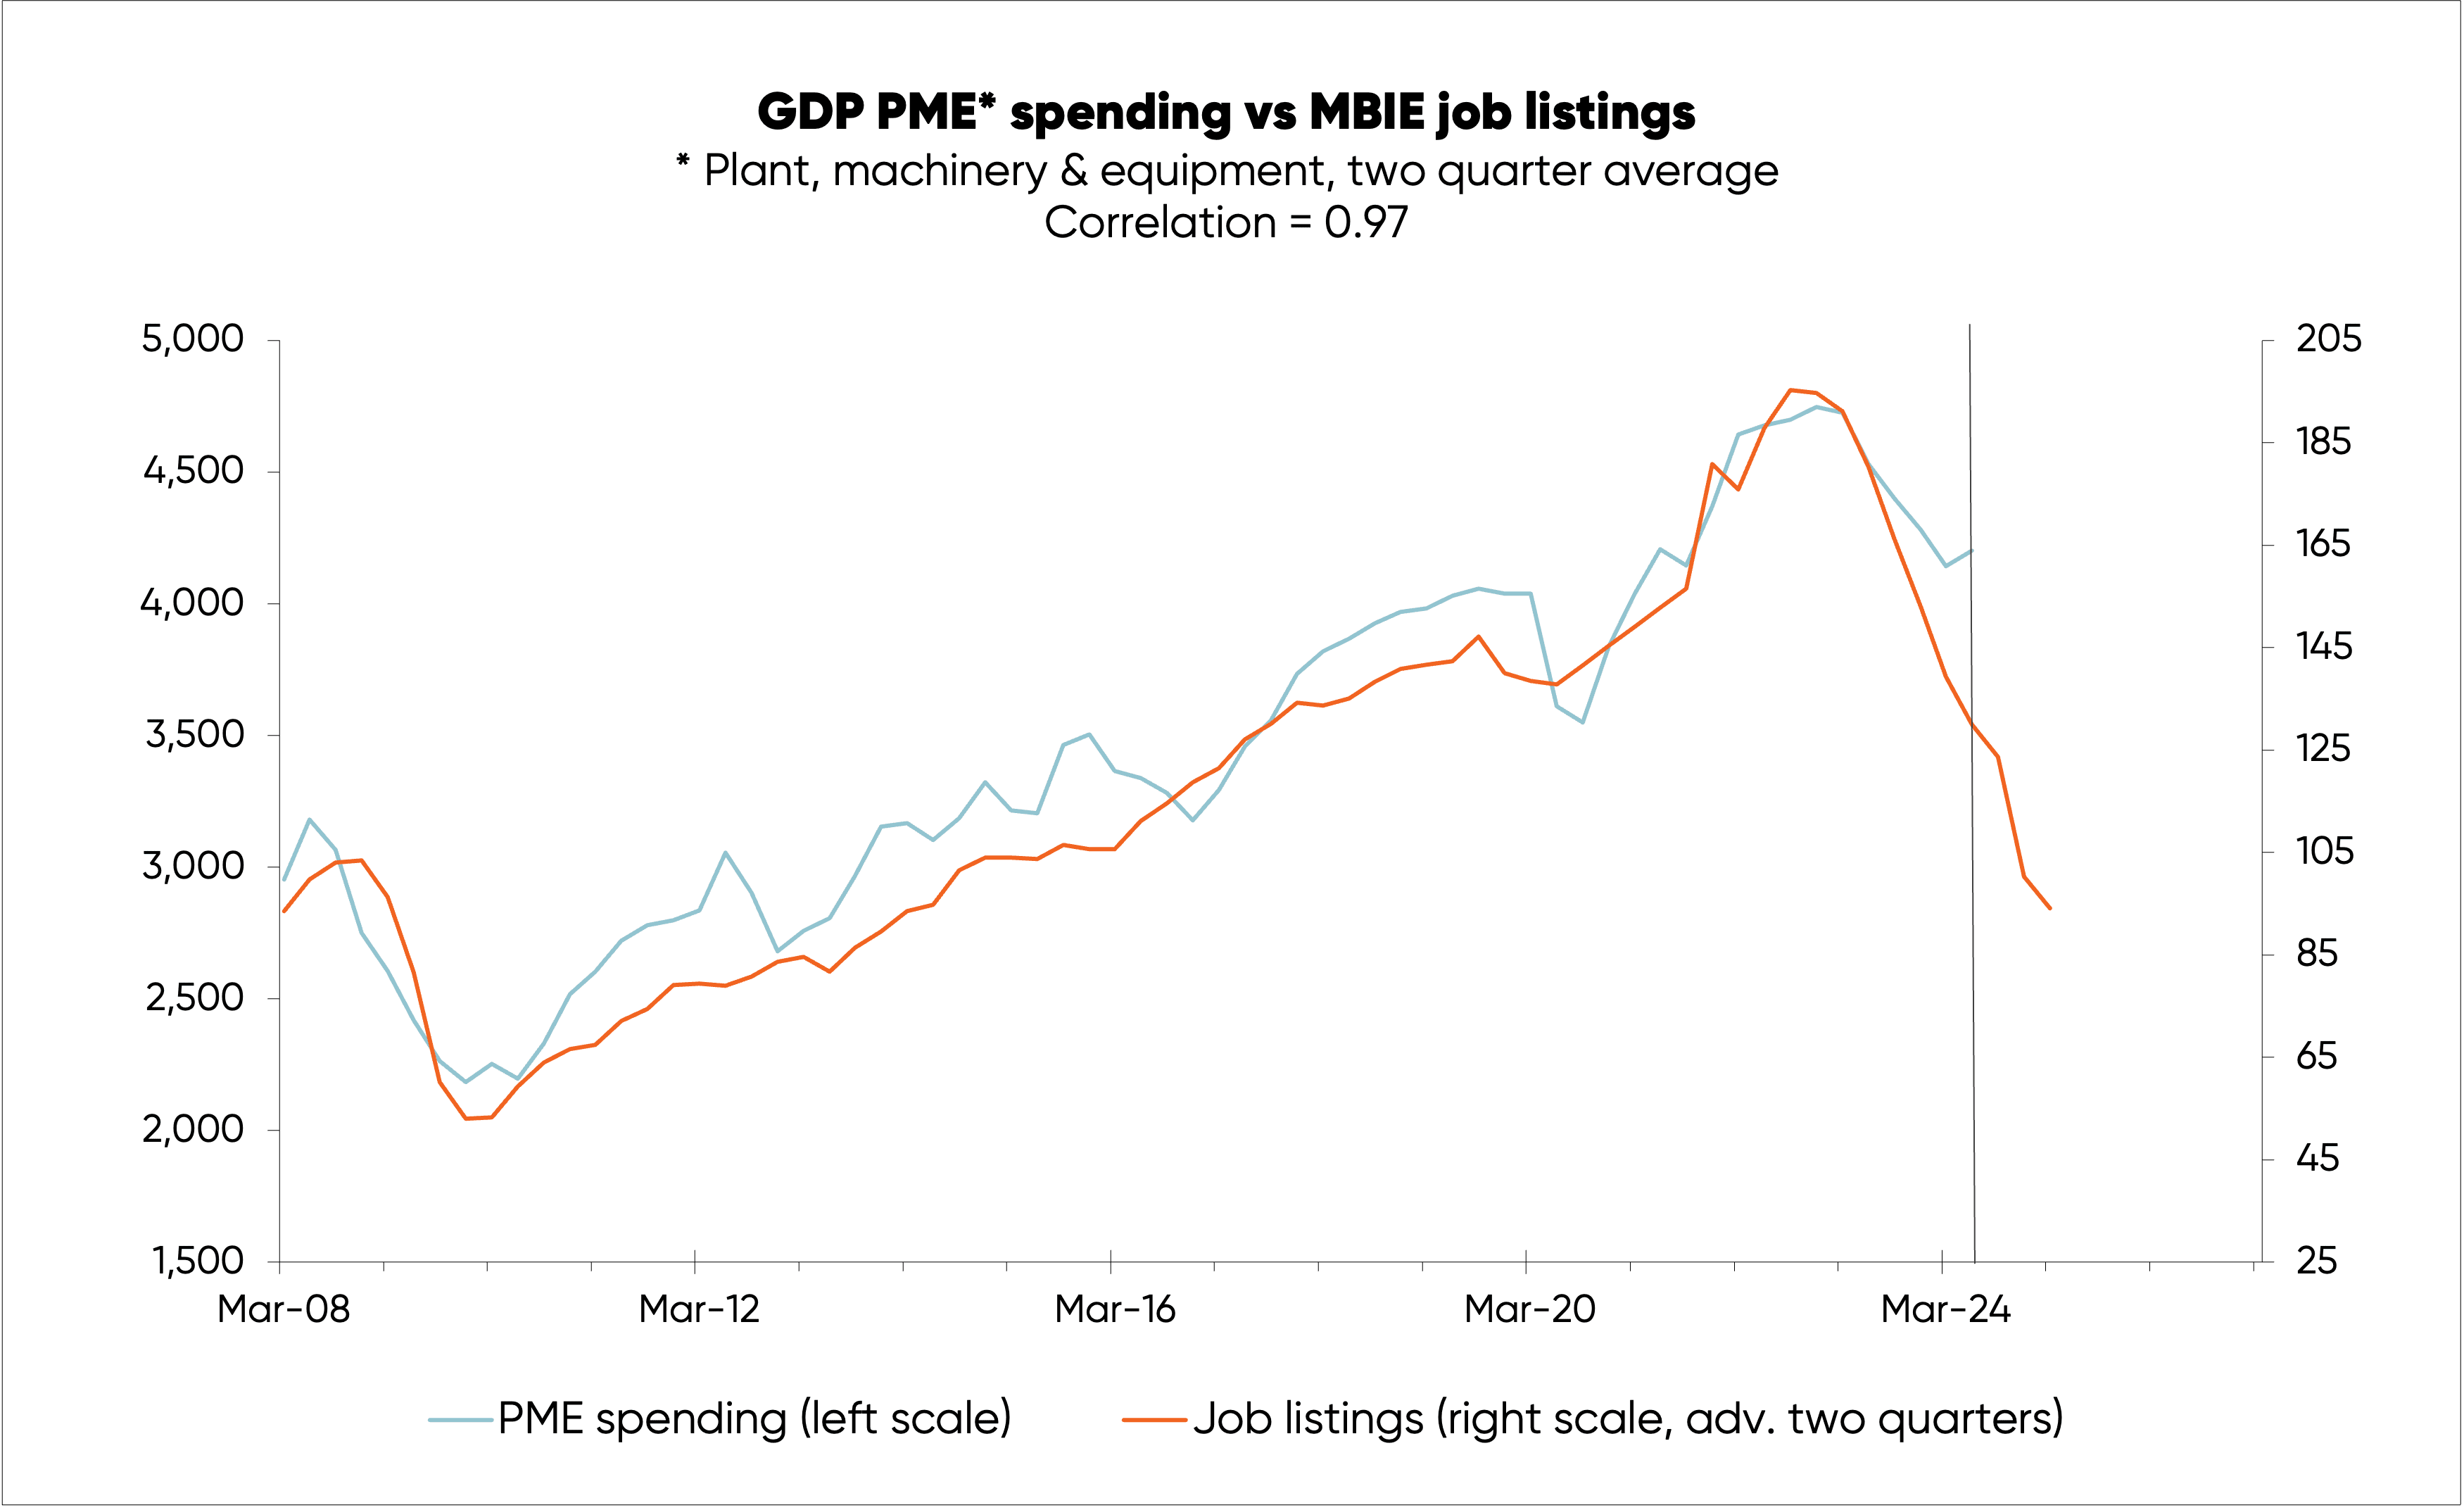
For example, job listings can be a useful leading indicator of levels of spend on plant, machinery, and equipment where more of a fall is likely. The second chart, below, tracks these two metrics against one another—with job listing advanced or leading PME spending by two quarters.
(A two-quarter average is used for PME spending to remove volatility, while job ads have been adjusted to remove the impact of Covid, and better show the underlying relationship).

Even a moderate fall in capital spending will have a big impact, meaning GDP growth is slow to reflect rising REINZ dwelling sales. This will drive further upside in the unemployment rate, which is likely to end up above 5.5%—potentially even as high as 6%.
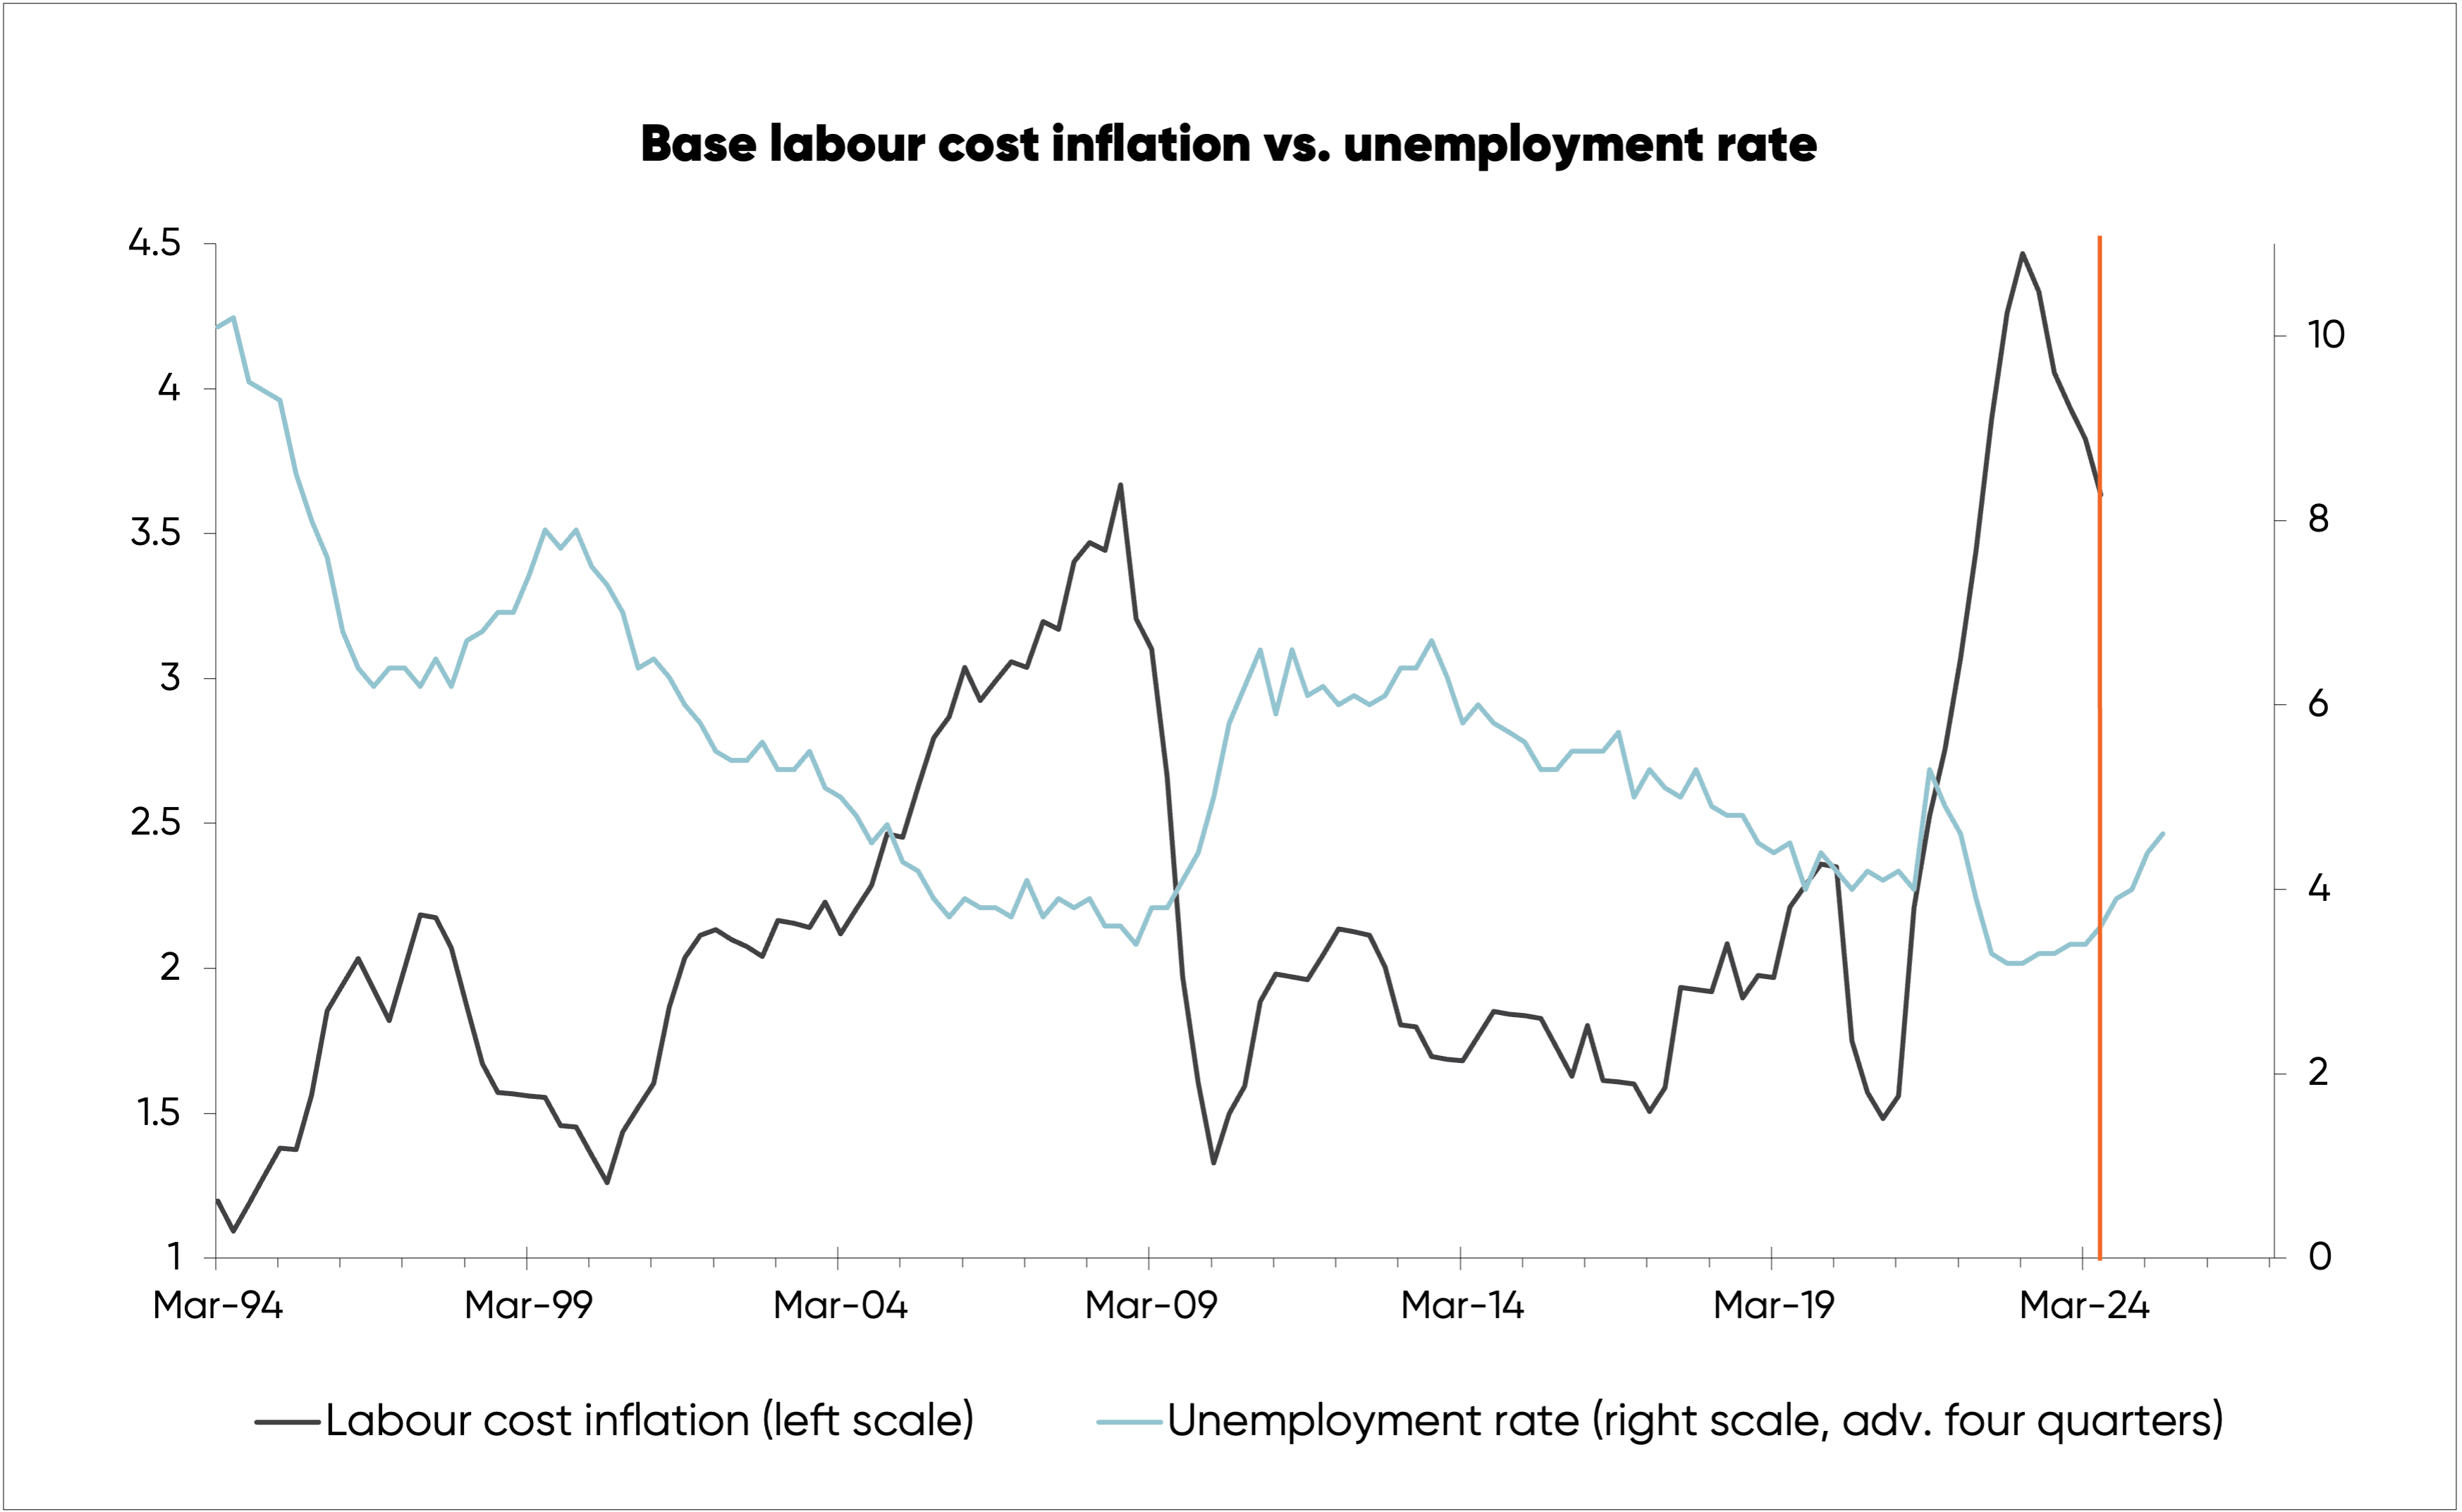
The RBNZ’s preferred measure of labour cost inflation (using a measure of base pay increases) has already started to fall sharply following the earlier growth in the unemployment rate. This is shown in the third chart, below, where the best fit has the unemployment rate leading or advanced by four quarters.

Growing levels of unemployment over the last year will mean further significant downside in labour cost inflation over the year to come. And further upside in the unemployment rate over the next 12 months will mean even lower labour cost inflation in 2026.
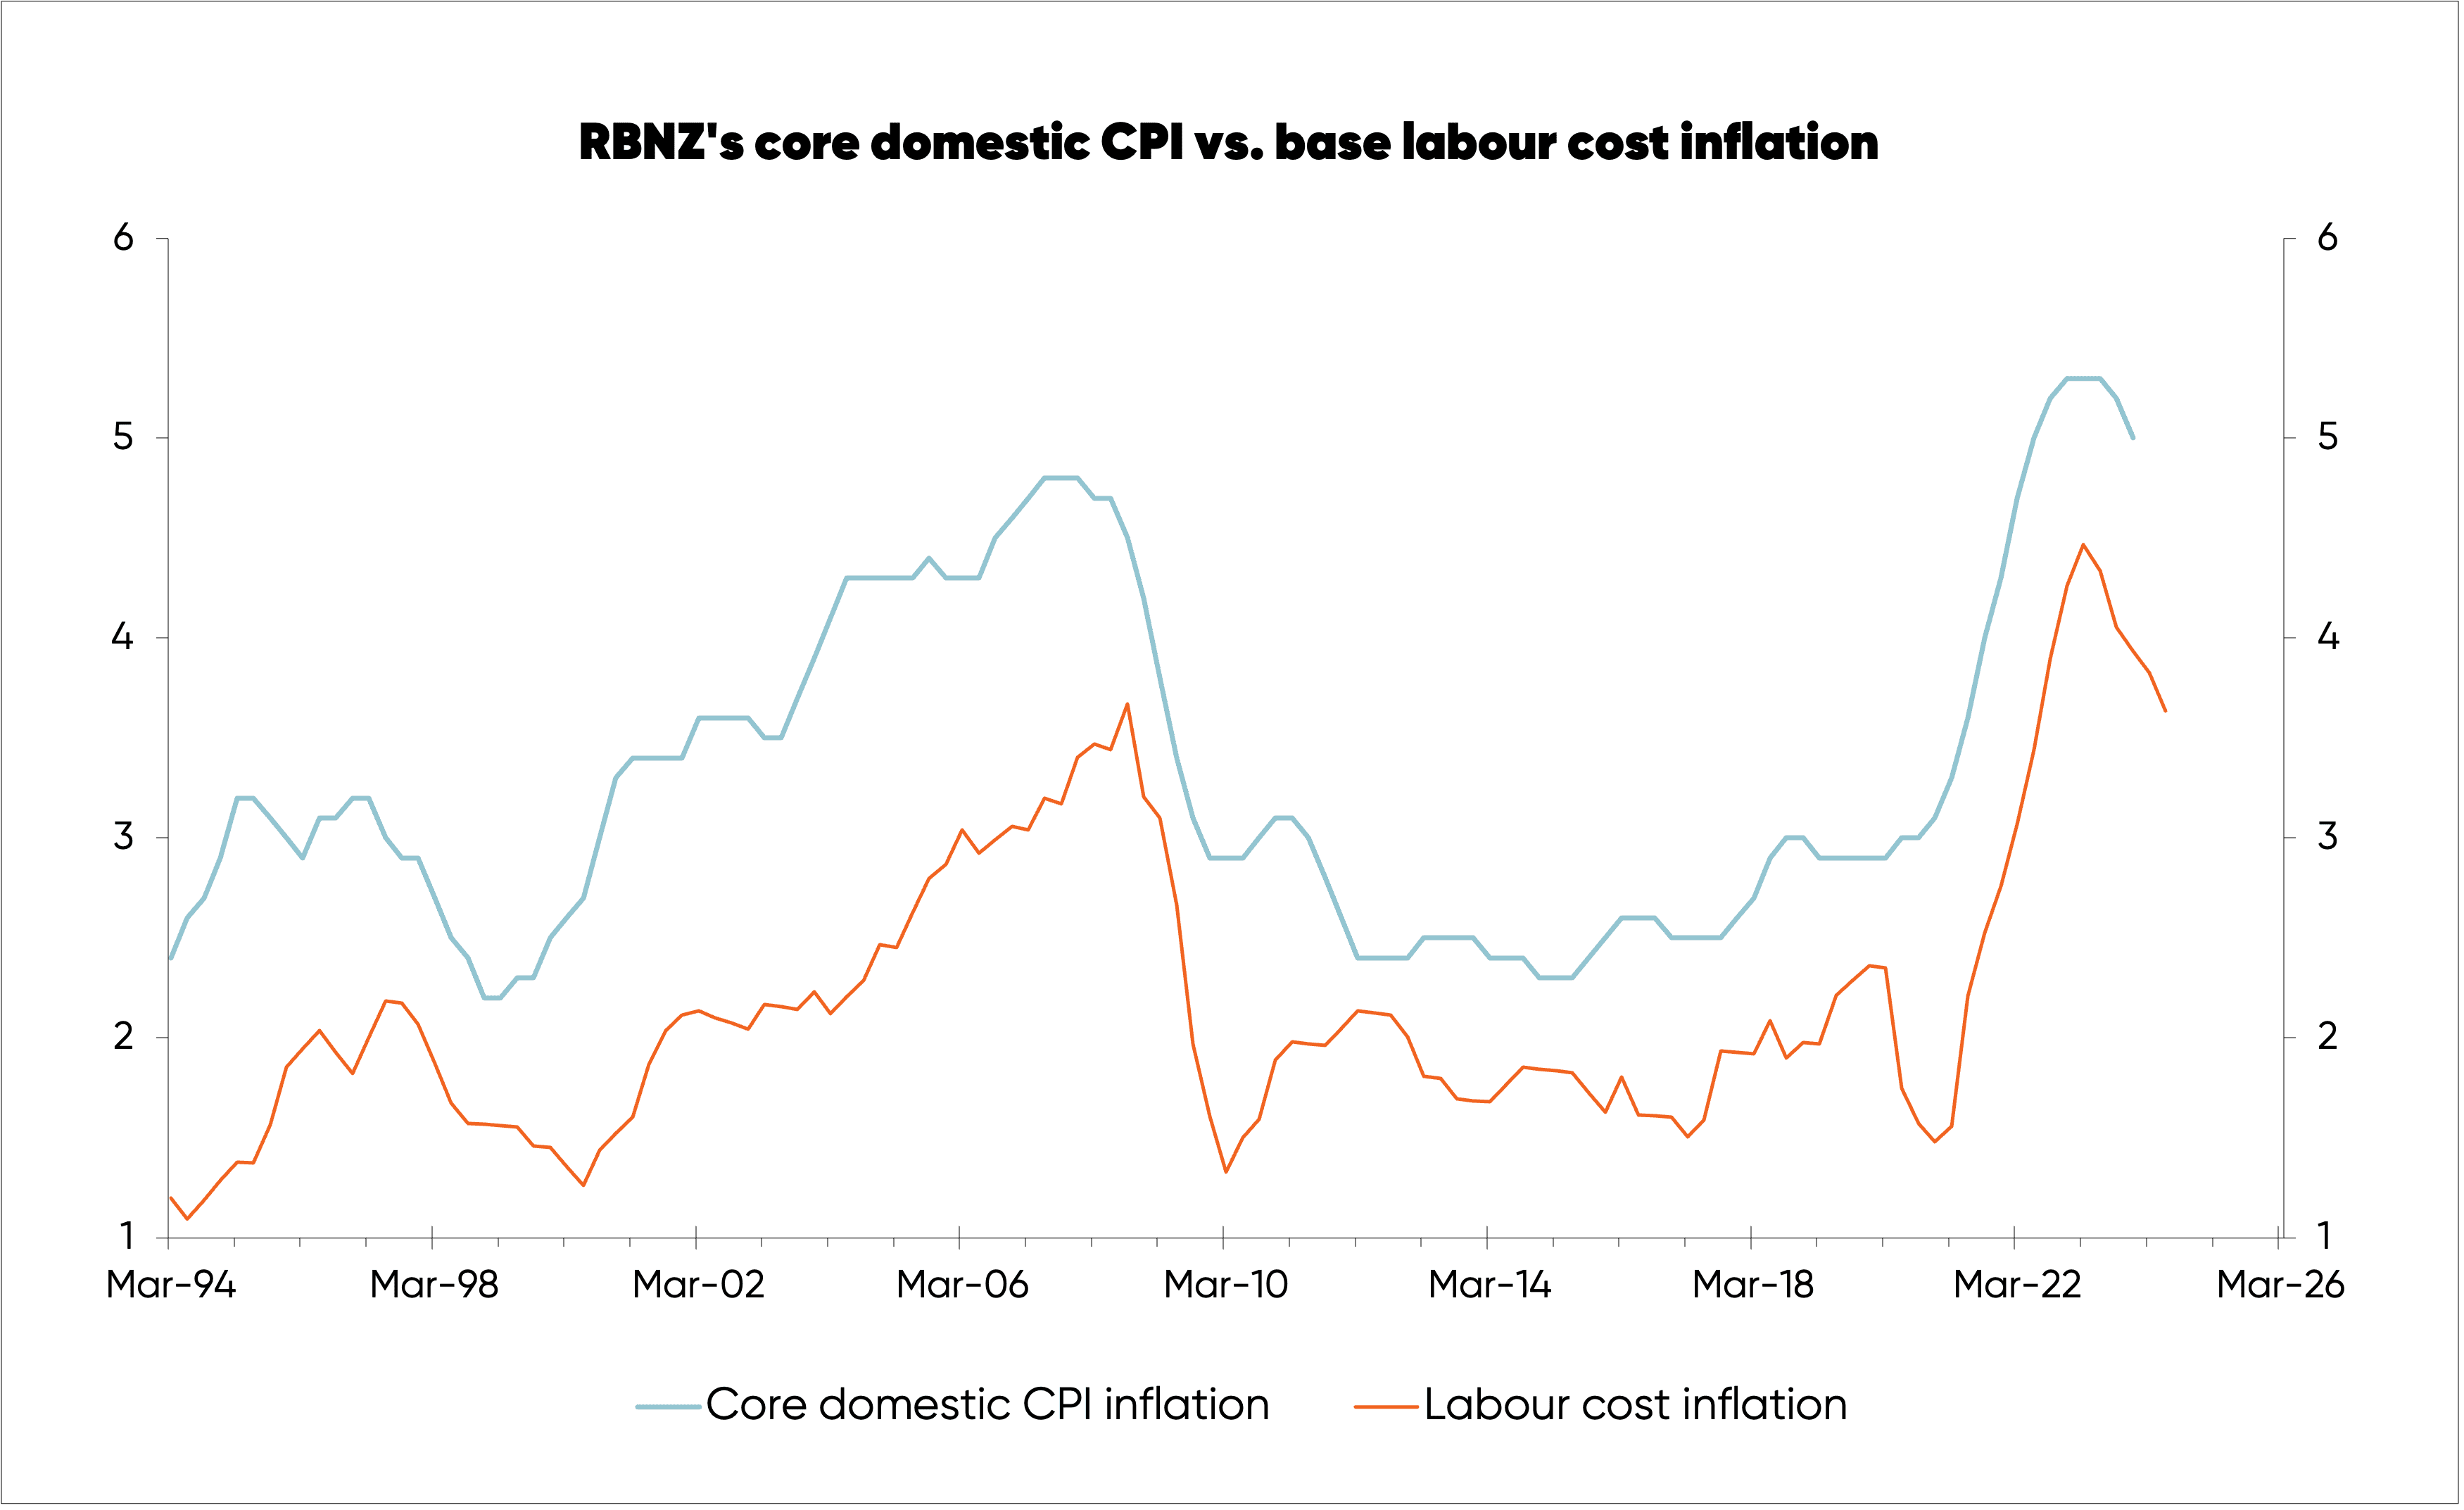
Labour cost inflation is one of the core metrics the RBNZ looks at in assessing inflation. As that abates, so too will the RBNZ’s core measure of domestic or non-tradable CPI inflation, which is at the heart of the inflation problem. The close link between the two is shown in the fourth chart.

Even as we start to see a recovery in the housing market, the normal lags in the economy will mean we can expect to see negative news about growth in parts of the economy for roughly another year, and good news about inflation for around another two years.
Such news will help reinforce the recovery by justifying further downside in interest rates. To add to this, the RBNZ will probably again cut too much as it did in the wake of Covid and overdo the impending growth phase.
By Rodney Dickens, Managing Director, Strategic Risk Analysis Ltd www.sra.co.nz.
