- Get started on your mortgage
- Buying your first home, next home, investing in property or just keen to review your mortgage?
- Apply online
- Put your savings to work
- Earn better returns and access your money with no penalties.
- Start investing now
Rodney's Ravings: The major flaws in the Reserve Bank's OCR decision-making


Post by Rodney Dickens
The latest Monetary Policy Statement confirmed the Reserve Bank (RBNZ) is hyper-focused on domestic CPI inflation – a measure that’s much less volatile than headline CPI inflation.
The blue line in the chart below tracks how core domestic inflation has moved over the last couple of decades.
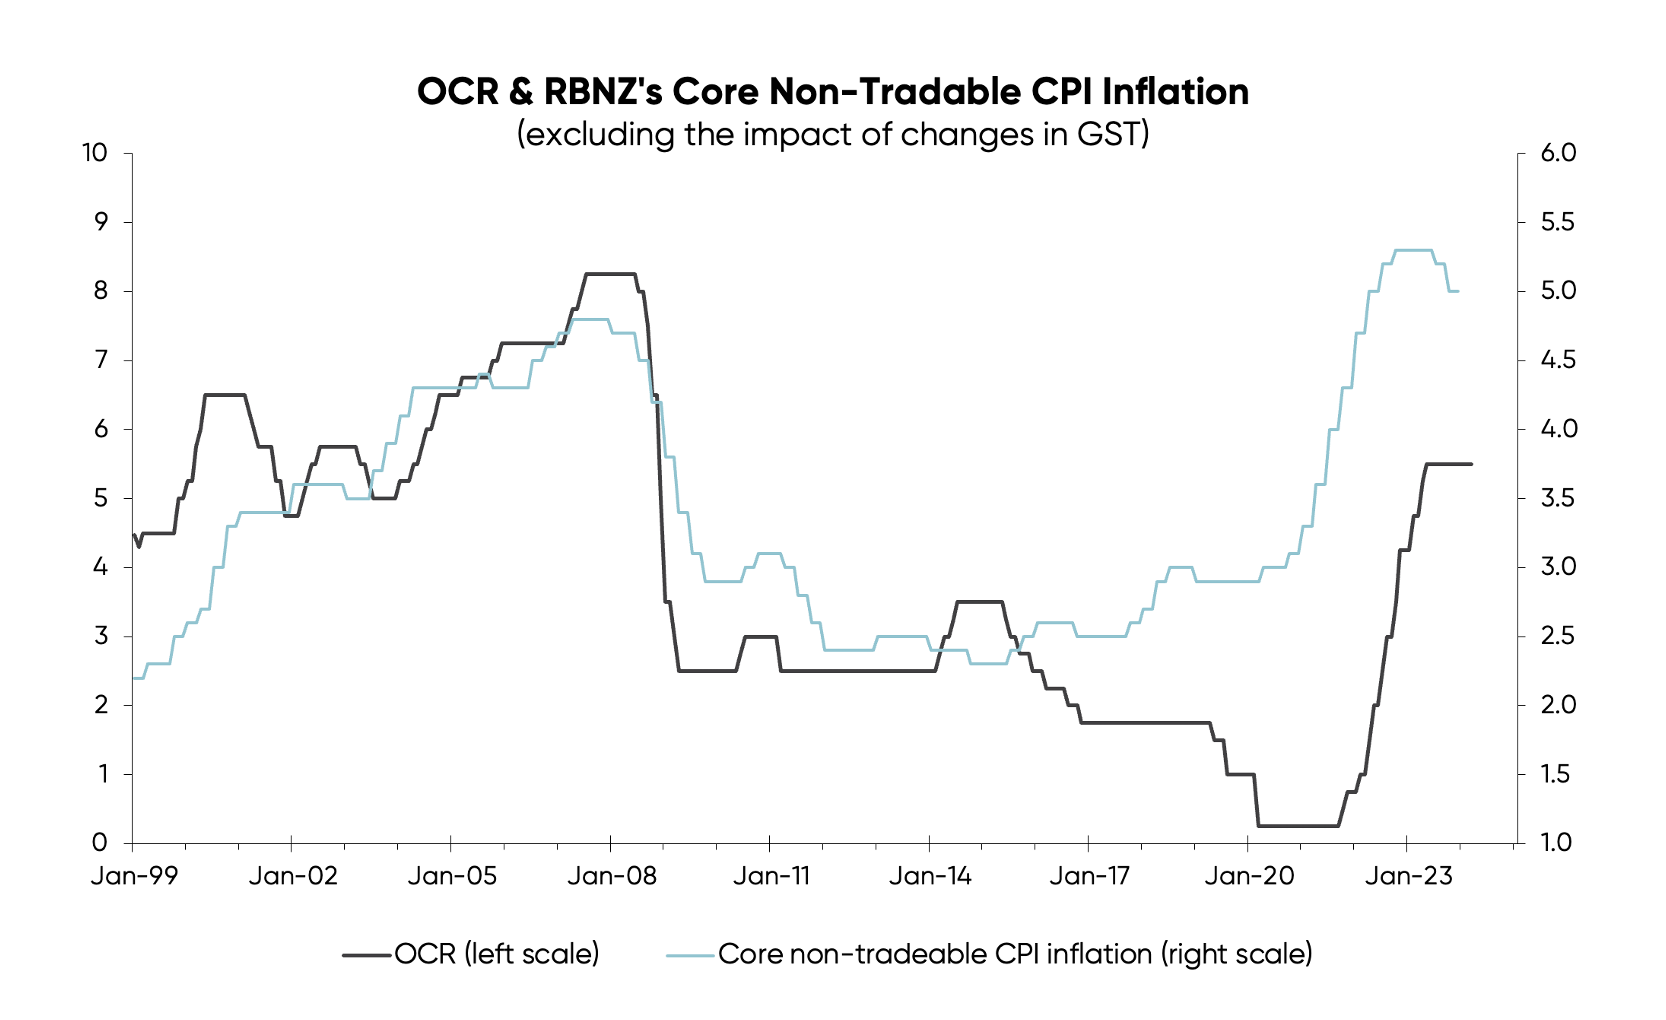
In an ideal world, the RBNZ would make moves to hike the Official Cash Rate (OCR) before the economy gets overheated, fuelling an inflation problem. But unfortunately, as you can see above, the RBNZ waits until domestic inflation rises before it hikes the OCR.
Even worse, this time around the RBNZ didn’t start pushing through OCR increases until after its own measure of core domestic inflation had reached 4%, above the top end of the 1-3% target range for headline inflation.
The issue here is that changes in the OCR take around 2 ½ years to have any effect on inflation. By doing what it did – and waiting until after an inflation problem had started before taking action – the RBNZ was more like three years behind the game.
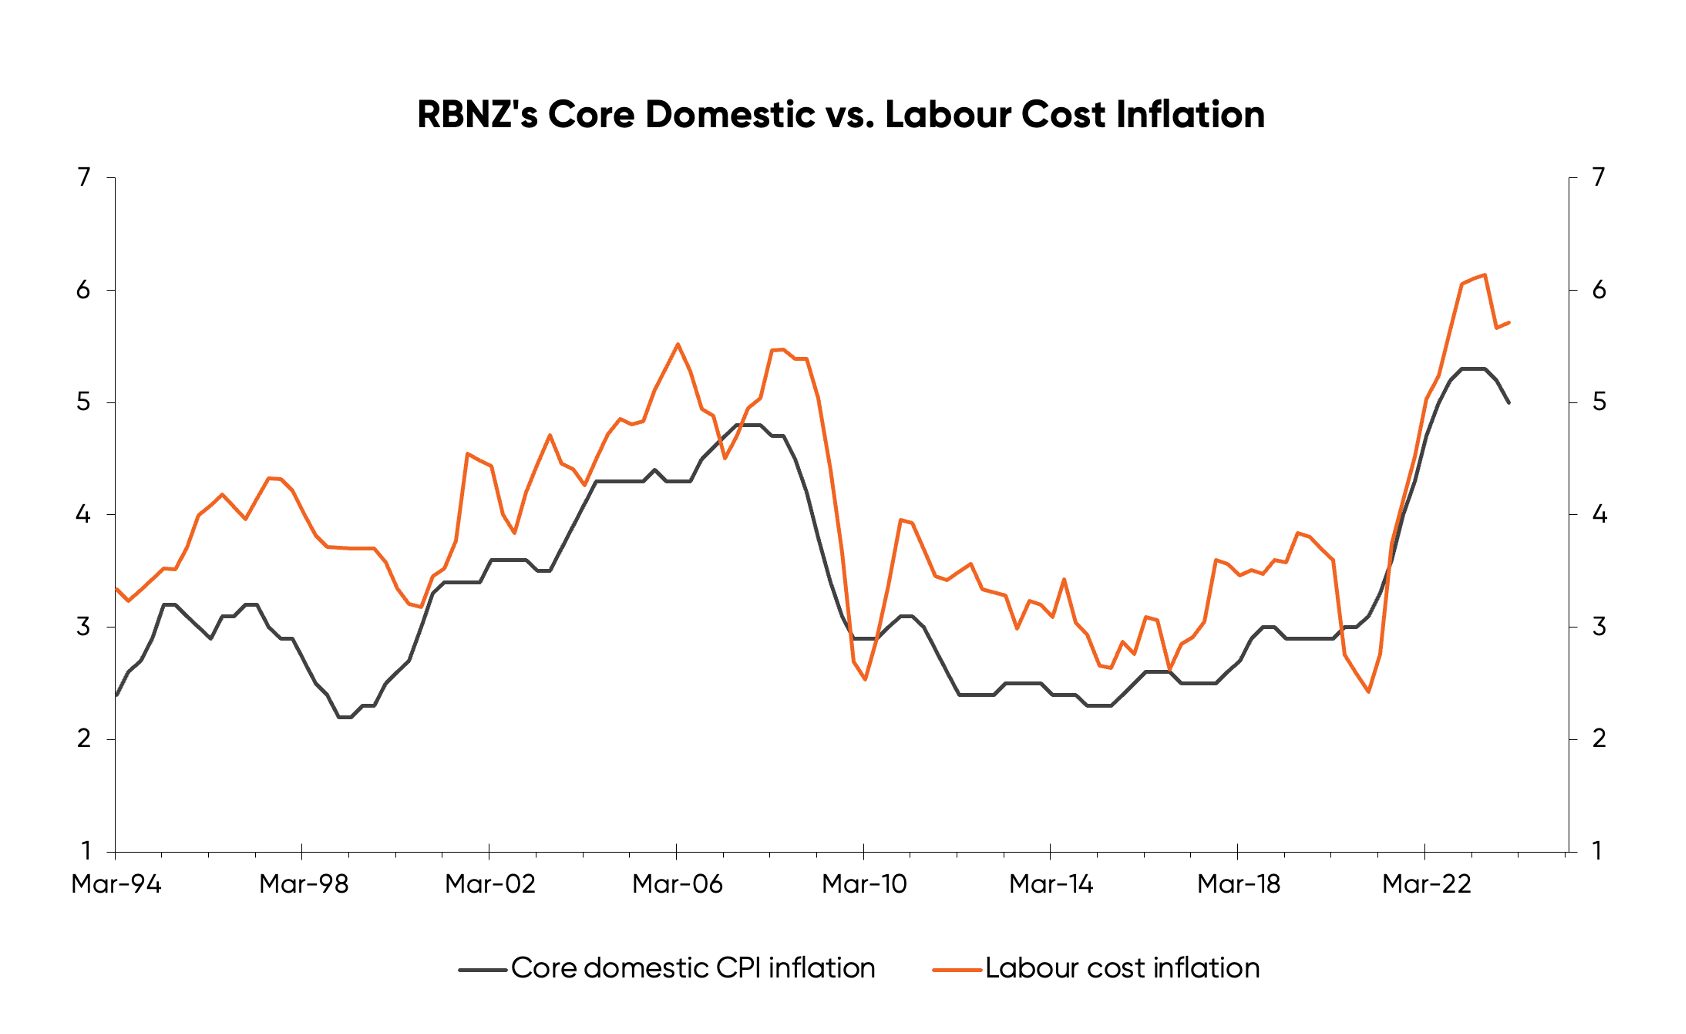
This allowed inflation to gain a foothold in the form of a wage-price spiral (illustrated in the second chart, below) that will feed on itself for a while and require quite a bit of economic pain to tame. Labour cost and core domestic inflation fell slightly at the end of 2023, but both are still well above levels the RBNZ can tolerate moving forward.
Then, looking to the third chart, you can see it takes over a year for changes in the average mortgage rate (which is closely linked to the OCR) to impact on consents for new dwellings.
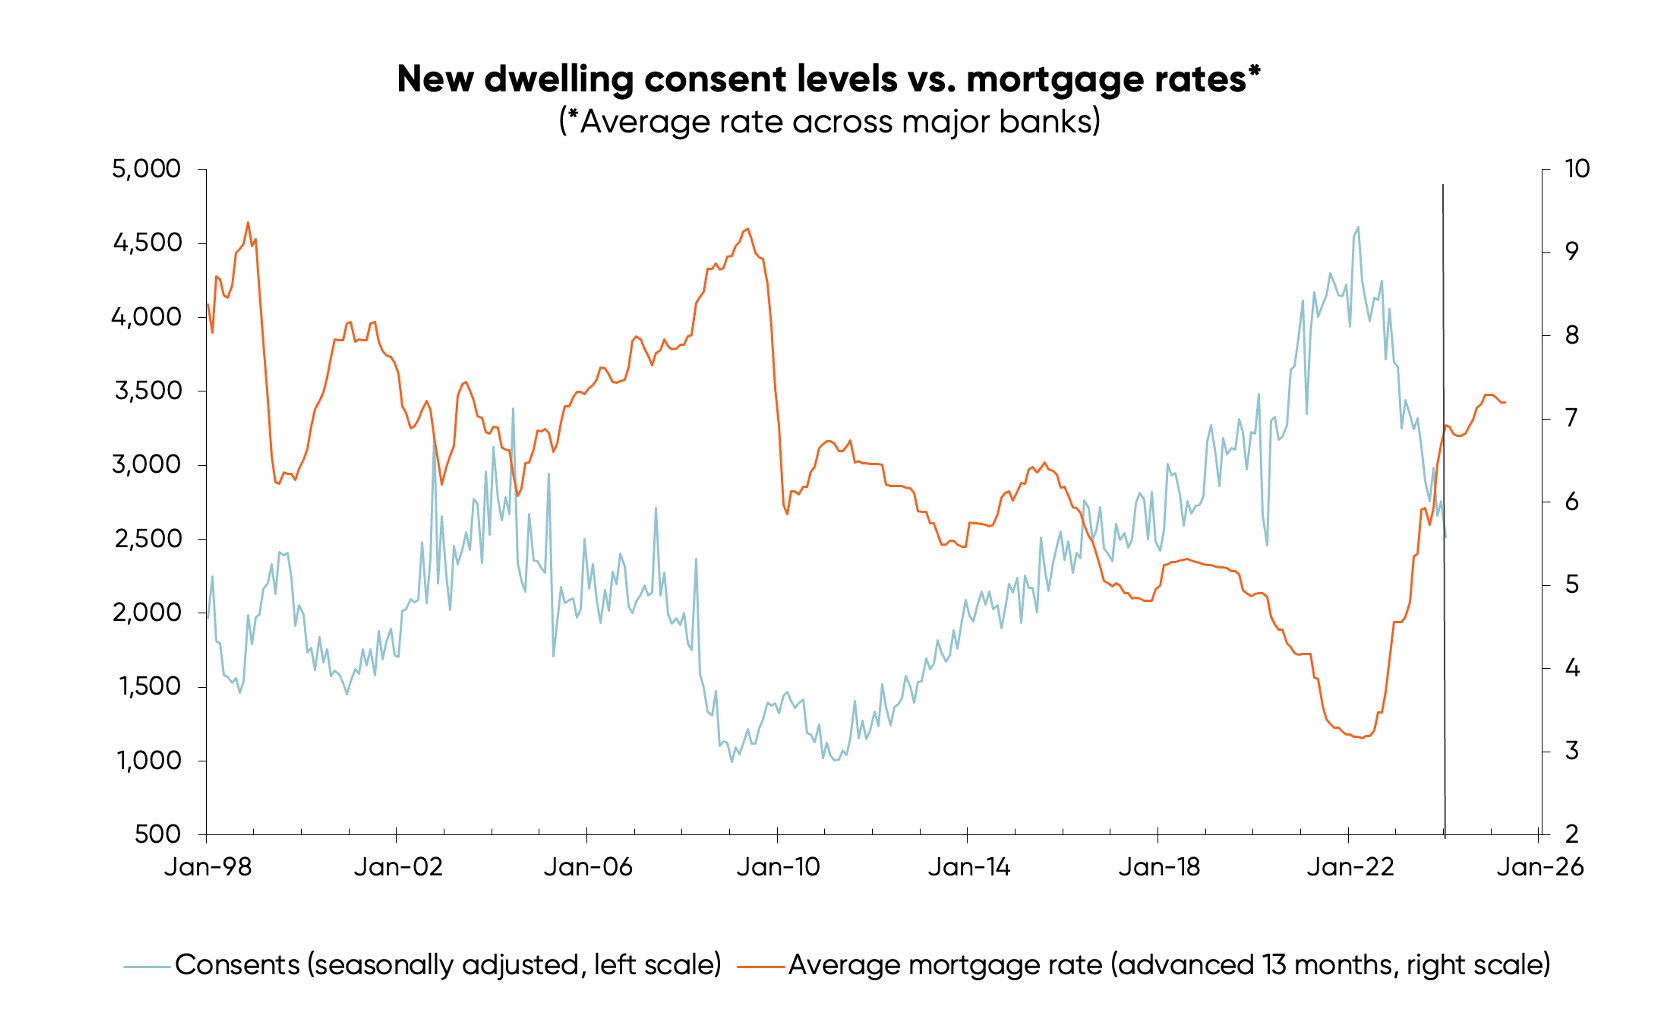
The interest rate line, shown in orange, has been advanced (or shifted to the right) by 13 months to factor this in – the result of which suggests that the fall in consents, being driven mainly by the increase in interest rates, isn’t over.
It takes around a quarter for consents to impact on the GDP component for residential building that plays a major part in driving GDP/economic growth (not shown in the charts).
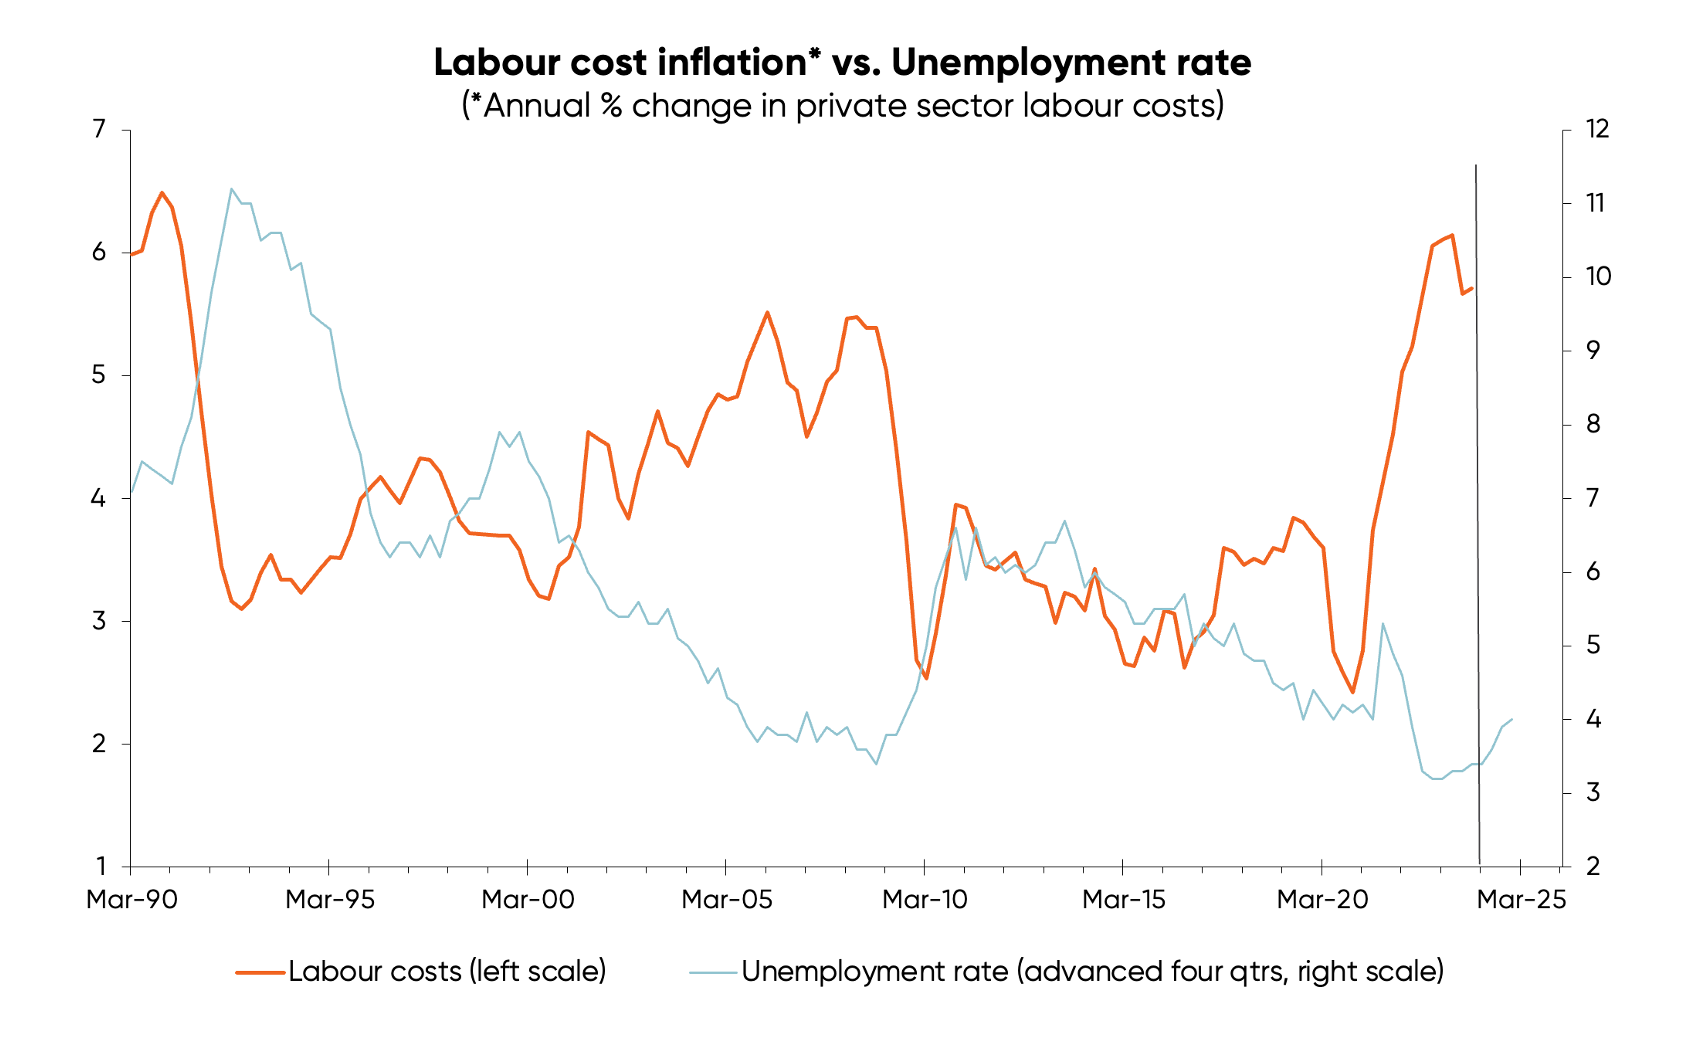
GDP then takes about a quarter to impact on employment and the unemployment rate (again, not shown).
And those changes in the unemployment rate in turn take around a year, another four quarters, to impact on what I believe is the best measure of inflation overall – labour cost inflation. The fourth chart below has the unemployment rate line advanced (shifted to the right) by four quarters for ease of comparison.
Looking back to the second chart, you’ll see the measure of labour cost inflation is quite closely linked with the RBNZ’s measure of core domestic inflation.
Add all of those delays together, and it takes around 10 quarters (two and a half years) for changes in the OCR to impact on inflation.
Unfortunately, just as the RBNZ is normally slow to realise an inflation problem is emerging, or has emerged, it is equally as slow to recognise when it has done enough damage to tame inflation. It’s likely to wait until it sees more evidence that core inflation is fallen before cutting the OCR, ensuring it stays well behind the game, and exacerbating the recession in the pipeline.
The fifth and final chart provides the best evidence of the RBNZ’s poor understanding of economic cycles and its poor OCR decisions.
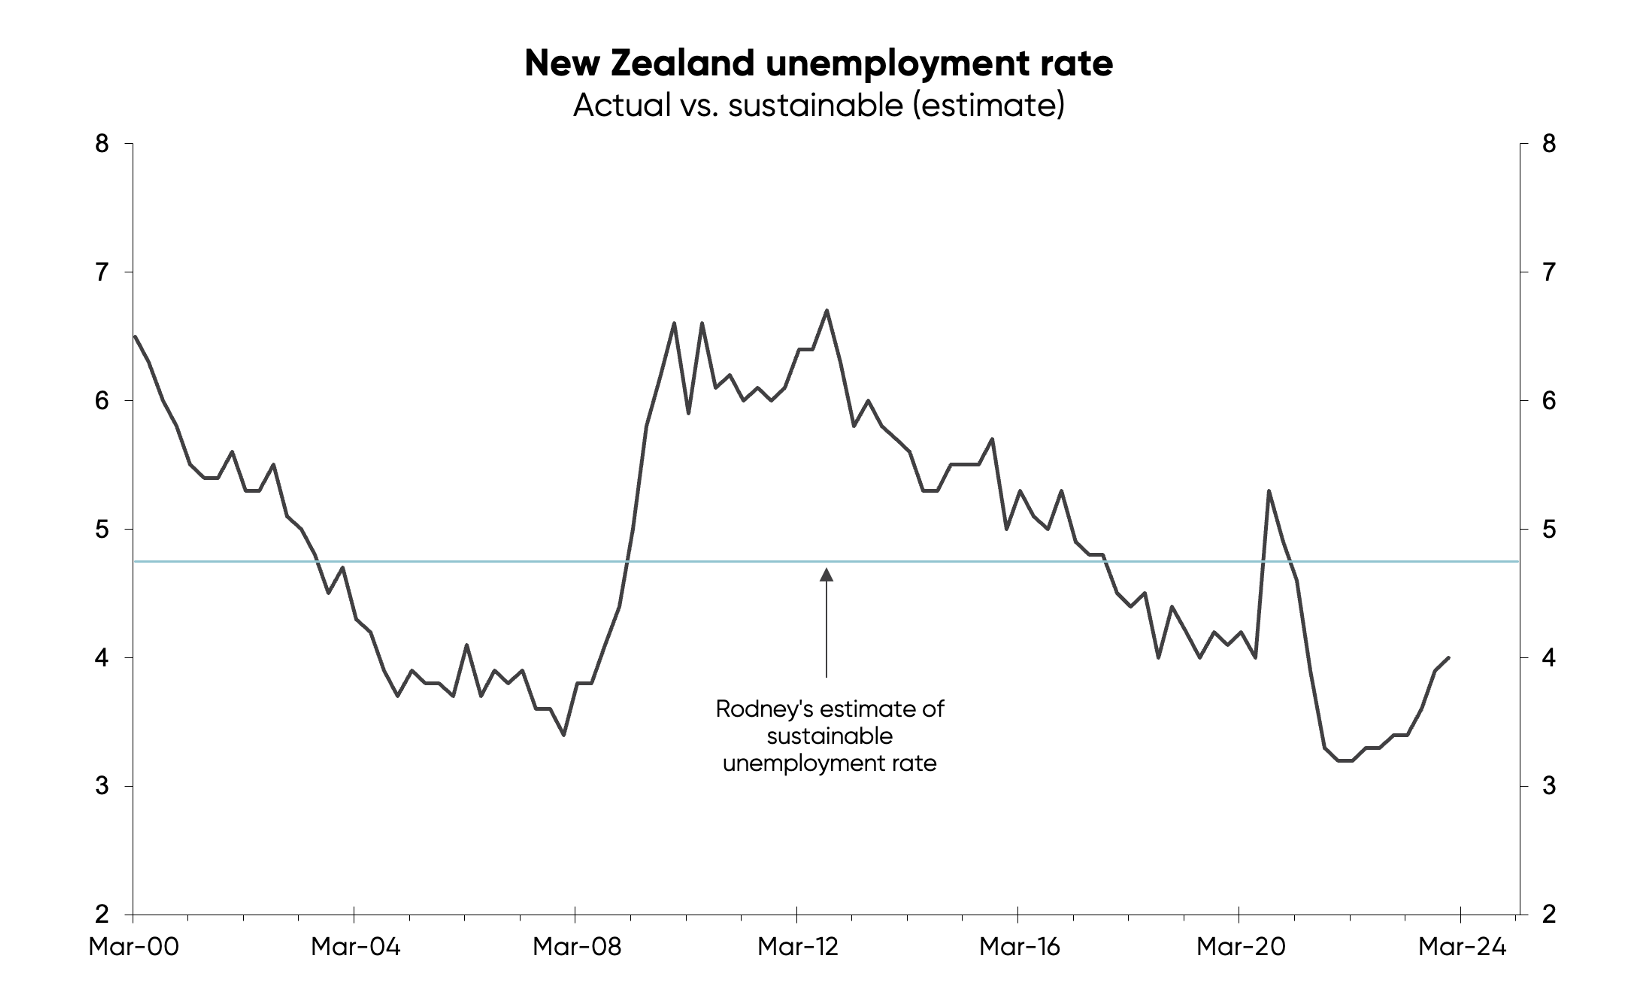
The unemployment rate is seldom close to the rate I estimate to be consistent with the RBNZ’s inflation target. The Reserve Bank stays pro-growth too long and allows the unemployment rate to fall too far before hiking.It then overreacts to the inflation problem and battles inflation for too long, resulting in the unemployment rate increasing more than needed.
Monetary policy is more like a sledgehammer than a scalpel and the RBNZ’s inept use of it makes economic cycles more extreme. It means there are reasonably protracted periods of solid GDP growth followed by recessions. Knowing this can be profitable for businesses and investors.
Enjoying our blog? Get the latest sent straight to your inbox
Receive updates on the housing market, interest rates and the economy. No spam, we promise.
The opinions expressed in this article should not be taken as financial advice, or a recommendation of any financial product. Squirrel shall not be liable or responsible for any information, omissions, or errors present. Any commentary provided are the personal views of the author and are not necessarily representative of the views and opinions of Squirrel. We recommend seeking professional investment and/or mortgage advice before taking any action.
To view our disclosure statements and other legal information, please visit our Legal Agreements page here.
