- Get started on your mortgage
- Buying your first home, next home, investing in property or just keen to review your mortgage?
- Apply online
- Put your savings to work
- Earn better returns and access your money with no penalties.
- Start investing now
Loan book performance
At Squirrel, we believe in transparency and we aim to provide you with all the statistics you need to make informed decisions about investing with us.
Here's our open loan book so you can take a look what's inside. With that said, please note that past performance does not guarantee similar performance in the future.


Default rates
The risk of borrower default is one of the most significant risks for Investors in peer‐to‐peer consumer finance loans. Borrower default can occur for a variety of reasons including the borrower falling on hard times, death or serious illness and on occasion unscrupulous behaviour. Broader environmental factors such as recessions etc. can also influence the prevalence of borrower default.
We report a loan as being in default when:
- It is no longer reasonably expected to be paid; and
- It is no longer reported to investor(s) as due to them.
Once a loan gets to this stage, it is written off with the outstanding interest and principal repaid to the investor(s) in that loan via the Reserve Fund (so long as there are sufficient funds available in the Reserve Fund). Our debt collection processes will continue, usually via an external debt collection agency and may involve legal action, to seek a recovery on the written off amount from the borrower. Any recoveries made are paid into the Reserve Fund.
The values and rates shown in the tables and charts below are the life‐to‐date values as at 30 April 2024.
Jump to a section:
Personal Loan origination, default and arrears statistics by risk grade
Approved borrowers on our Platform are allocated a risk grade based on their strength across our credit criteria. Their risk grade helps determine the level of reserve levy that applies to their loan and therefore contributes to the overall borrower interest rate.
The table below shows the performance of Personal Loans within each risk grade to date:
Life to date Personal Loans by risk grade
| Risk Grade | A | B | C | D | E | Total |
| Number of loans originated | 790 | 1,414 | 974 | 221 | 39 | 3,438 |
| Value of loans originated | 24,658,820 | 34,874,091 | 16,823,963 | 2,847,109 | 814,296 | 80,018,280 |
| Number of active loans1 | 137 | 130 | 63 | 8 | 5 | 343 |
| Active loan balance | 4,592,640 | 4,706,455 | 1,602,454 | 128,866 | 152,746 | 11,183,160 |
| Number of loans in default | 5 | 29 | 56 | 20 | 4 | 114 |
| Value of loans in default | (102,916) | (348,483) | (547,415) | (132,841) | (19,575) | (1,151,230) |
| Recoveries on defaulted loans | 34,413 | 34,168 | 129,849 | 36,065 | 10,473 | 244,969 |
| Gross default rate | 0.4% | 1.0% | 3.3% | 4.7% | 2.4% | 1.4% |
| Net default rate2 | 0.3% | 0.9% | 2.5% | 3.4% | 1.1% | 1.1% |
| Number of loans in arrears3 | - | 5 | 13 | 3 | 2 | 23 |
| Value of loans in arrears | - | 143,550 | 156,135 | 21,361 | 129,695 | 450,741 |
| Arrears rate2 | 0.0% | 3.1% | 9.7% | 16.6% | 84.9% | 4.0% |
Personal Loan origination, default and arrears statistics by secured and unsecured
Personal Loans made via our Platform may be secured or unsecured (depending on product and loan value). Secured Loans are secured over an asset which provides some opportunity for recovery in the case of borrower default. Any security provided by the borrower will be held by the Squirrel P2P Trustee in accordance with the terms of the borrower agreement and the loan agreement. Where the loan is covered by a Reserve Fund, the security is taken for the benefit of the Squirrel P2P lending platform and the Reserve Fund and not for any investor individually.
Life to Date Personal Loan Performance
| Secured | Unsecured | Total | % Secured | |
| Number of loans originated | 1,643 | 1,795 | 3,438 | 48% |
| Value of loans originated | 57,874,607 | 22,143,673 | 80,018,280 | 72% |
| Number of active loans | 267 | 76 | 343 | 78% |
| Current balance of active loans | 10,417,796 | 765,364 | 11,183,160 | 93% |
| Number of loans in default | 30 | 84 | 114 | 26% |
| Value of loans in default | (446,545) | (704,685) | (1,151,230) | 39% |
| Recoveries on defaulted loans | 101,990 | 144,978 | 244,969 | 42% |
| Gross default rate | 0.8% | 3.2% | 1.4% | n/a |
| Net default rate (after recoveries) | 0.6% | 2.5% | 1.1% | n/a |
| Number of loans in arrears1 | 14 | 9 | 23 | 61% |
| Value of loans in arrears1 | 407,525 | 43,217 | 450,741 | 90% |
| Arrears rate1 | 3.9% | 5.6% | 4.0% | n/a |

The table below contains the loan volumes and default and arrears statistics for each of our Personal Loan cohorts:
| Loan cohort4 | Loans originated | Active balance3 | Loans in default | Defaults recovered | Gross default rate | Net default rate2 | Loans in arrears3 | Arrears rate |
| 2015-H2 | 863,880 | - | (20,708) | 4,324 | 2.4% | 1.9% | - | 0.0% |
| 2016-H1 | 3,221,383 | - | (167,544) | 16,907 | 5.2% | 4.7% | - | 0.0% |
| 2016-H2 | 3,433,480 | - | (76,954) | 17,459 | 2.2% | 1.7% | - | 0.0% |
| 2017-H1 | 4,728,775 | - | (112,395) | 30,971 | 2.4% | 1.7% | - | 0.0% |
| 2017-H2 | 6,584,837 | 16,863 | (344,344) | 99,963 | 5.2% | 3.7% | (16,863) | 100.0% |
| 2018-H1 | 5,072,708 | - | (48,599) | 17,025 | 1.0% | 0.7% | - | 0.0% |
| 2018-H2 | 5,260,814 | 5,379 | (55,743) | 7,655 | 1.1% | 0.9% | - | 0.0% |
| 2019-H1 | 4,941,616 | 31,733 | (99,151) | 18,595 | 2.0% | 1.6% | - | 0.0% |
| 2019-H2 | 6,786,417 | 220,751 | (57,459) | 11,782 | 0.8% | 0.7% | (38,455) | 17.4% |
| 2020-H1 | 5,644,925 | 533,963 | (57,482) | 6,585 | 1.0% | 0.9% | (36,428) | 6.8% |
| 2020-H2 | 6,359,449 | 473,361 | (109,347) | 13,702 | 1.7% | 1.5% | (56,051) | 11.8% |
| 2021-H1 | 4,724,447 | 534,055 | (1,504) | - | 0.0% | 0.0% | (17,787) | 3.3% |
| 2021-H2 | 5,097,908 | 860,106 | - | - | 0.0% | 0.0% | (35,839) | 4.2% |
| 2022-H1 | 5,145,796 | 1,626,725 | - | - | 0.0% | 0.0% | (65,807) | 4.0% |
| 2022-H2 | 5,287,256 | 2,156,920 | - | - | 0.0% | 0.0% | (102,678) | 4.8% |
| 2023-H1 | 3,010,236 | 1,795,077 | - | - | 0.0% | 0.0% | (80,798) | 4.5% |
| 2023-H2 | 2,595,739 | 1,696,775 | - | - | 0.0% | 0.0% | - | 0.0% |
| 2024-H1 | 1,258,614 | 1,231,417 | - | - | 0.0% | 0.0% | - | 0.0% |
| Total | 80,018,280 | 11,183,160 | (1,151,230) | 244,969 | 1.4% | 1.1% | (450,741) | 4.0% |
Home Loan risk grade
We’ve shown the credit risk grade that has been assigned to each loan in the portfolio. The Credit Risk grade is made up of two pieces:
- Quality of the borrower: Each borrower is given a rating of A – E, A being the highest quality. In determining the grade, we take into account things like the borrower’s credit scores, financial position, and financial conduct.
- Quality of the security: Each security (what we hold the first mortgage over) is given a rating from 1 – 5, 1 being the highest quality. In determining the grade, we take into account things like where the property is located, the nature of the property and any dwelling, and a close look at the title of the property
The Life To Date table includes all Home Loans that Squirrel has written. The Active Loans table shows all loans currently held by investors on the Squirrel platform. The last two tables show the mix by borrower and security risk grade.
Life to date Home Loans by risk grade
| Borrower/Security Risk Grade | A | B | C | D | E | Total | Mix |
| 1 | 10 | 14 | 2 | 0 | 2 | 28 | 26% |
| 2 | 13 | 49 | 10 | 0 | 0 | 72 | 67% |
| 3 | 0 | 1 | 4 | 0 | 0 | 5 | 5% |
| 4 | 0 | 0 | 0 | 0 | 0 | 0 | 0% |
| 5 | 2 | 0 | 0 | 0 | 0 | 2 | 2% |
| Total | 25 | 64 | 16 | 0 | 2 | 107 | 100% |
| Mix | 23% | 60% | 15% | 0% | 2% | 100% |
Active Retail Home Loans by risk grade
| Borrower/Security Risk Grade | A | B | C | D | E | Total | Mix |
| 1 | 4 | 0 | 2 | 0 | 0 | 6 | 18% |
| 2 | 5 | 18 | 3 | 0 | 0 | 26 | 76% |
| 3 | 0 | 0 | 2 | 0 | 0 | 2 | 6% |
| 4 | 0 | 0 | 0 | 0 | 0 | 0 | 0% |
| 5 | 0 | 0 | 0 | 0 | 0 | 0 | 0% |
| Total | 9 | 18 | 7 | 0 | 0 | 34 | 100% |
| Mix | 26% | 53% | 21% | 0% | 0% | 100% |
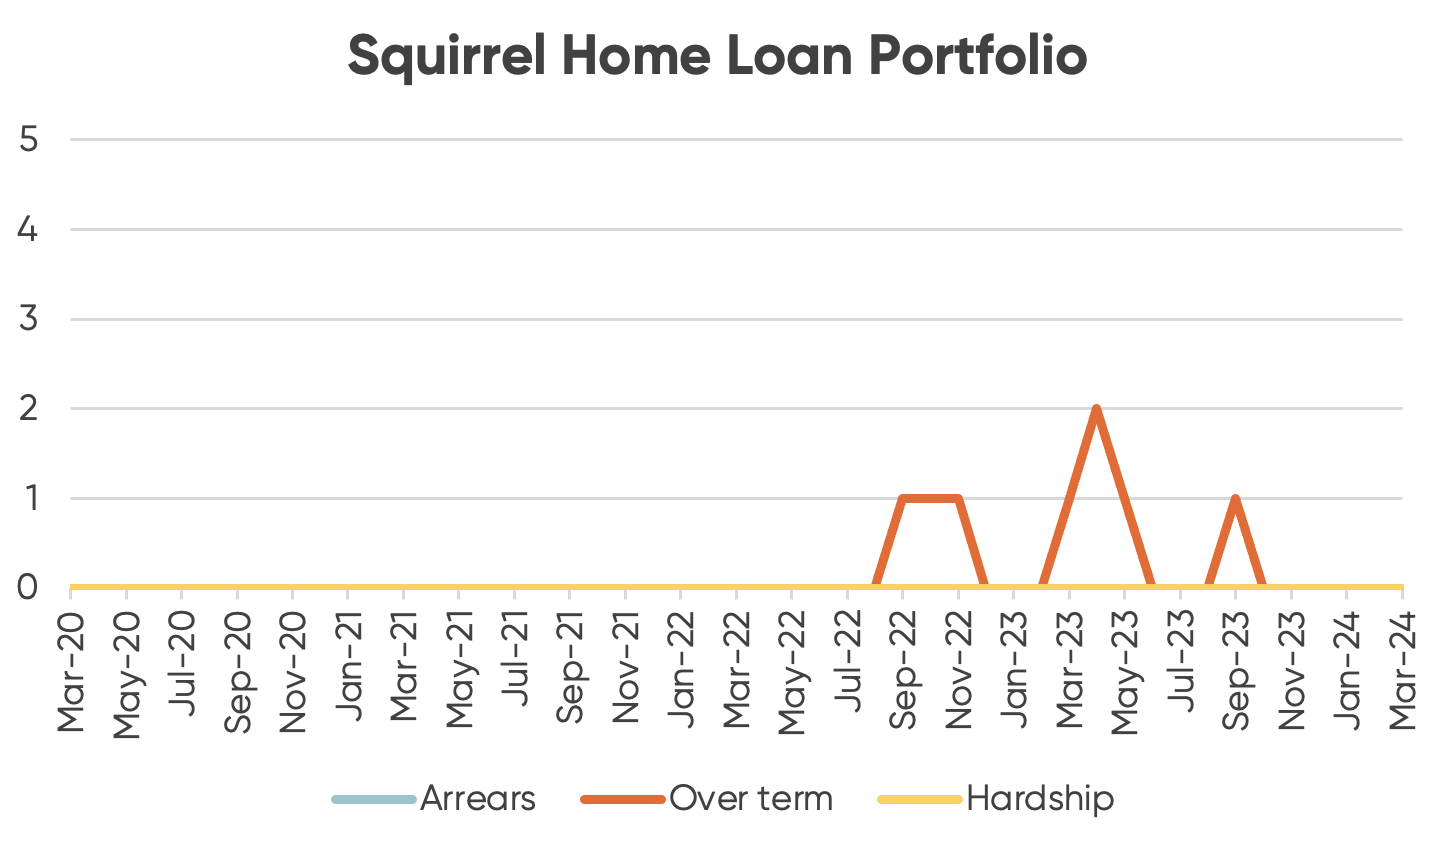
Home Loan Arrears, Default, Hardship, and Over term information
The graph on the right shows the number of loans that have fallen into 30days+ Arrears, Default, Hardship or Over term positions. Note that a 0 outcome means no loans have met these criteria.
- Arrears greater than 30days: The borrower has missed a payment and that payment is not made within 30days of the payment due date.
- Hardship: Loans that have been approved under the loan agreements hardship provisions.
- Default: Loans that have progressed to the point of there not being a reasonable chance of repayment by the borrower, and a mortgagee sale is being progressed.
- Over term: Loan has exceeded its contracted maturity date and is performing. Default interest is accruing.
Life to date Defaults
- The net value of Defaults: $0
- The net write off rate: 0.00%
Construction Loans
We’ve shown below the credit risk grade that has been assigned to each loan in the portfolio. The Credit Risk grade is made up of two pieces:
- Quality of the borrower: Each borrower is given a rating of A – E, A being the highest quality. In determining the grade, we take into account things like the borrower’s credit scores, financial position, and financial conduct.
- Quality of the security: Each security (what we hold the first mortgage over) is given a rating from 1 – 5, 1 being the highest quality. In determining the grade, we take into account things like where the property is located, the nature of the property and any dwelling, and a close look at the title of the property
The Life To Date table includes all Construction Loans that Squirrel has written. The Active Loans table shows all loans currently held by investors on the Squirrel platform. The last two tables show the mix by borrower and security risk grade.
Life to Date Construction Loans by Risk Grade
| Borrower/Security Risk Grade | A | B | C | D | E | Total | Mix |
| 1 | 49 | 31 | 5 | 1 | 0 | 86 | 17% |
| 2 | 48 | 114 | 52 | 2 | 3 | 219 | 44% |
| 3 | 84 | 75 | 26 | 3 | 1 | 189 | 38% |
| 4 | 3 | 1 | 1 | 1 | 0 | 6 | 1% |
| 5 | 3 | 0 | 0 | 0 | 0 | 3 | 1% |
| Total | 187 | 221 | 84 | 7 | 4 | 503 | 100% |
| Mix | 37% | 44% | 17% | 1% | 1% | 100% |
Active Retail Construction Loans by Risk Grade
| Borrower/Security Risk Grade | A | B | C | D | E | Total | Mix |
| 1 | 14 | 13 | 0 | 0 | 0 | 27 | 15% |
| 2 | 11 | 32 | 7 | 0 | 0 | 50 | 28% |
| 3 | 55 | 34 | 7 | 0 | 0 | 96 | 54% |
| 4 | 1 | 0 | 1 | 1 | 0 | 3 | 2% |
| 5 | 3 | 0 | 0 | 0 | 0 | 3 | 2% |
| Total | 84 | 79 | 15 | 1 | 0 | 179 | 100% |
| Mix | 47% | 44% | 8% | 1% | 0% | 100% |
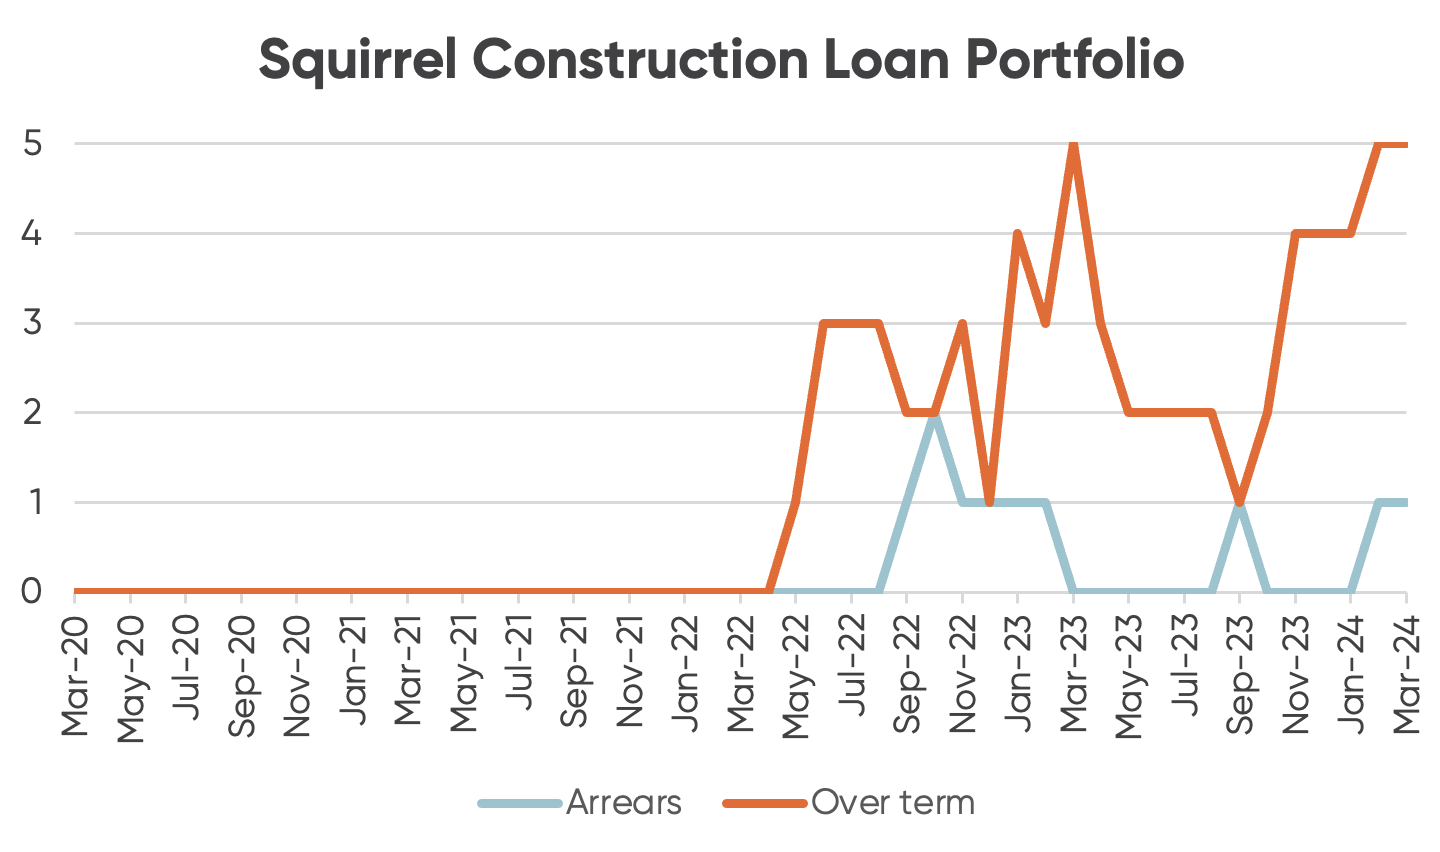
Construction Loans Arrears, Over term, and default information
The graph shows the number of loans that have fallen into 30days+ Arrears or Over term positions. Note that a 0 outcome means no loans have met these criteria.
- Arrears greater than 30 days: The borrower has missed a payment and that payment is not made within 30 days of the payment date
- Default: Loans that have progressed to the point of there not being a reasonable chance of repayment by the borrower, and a mortgagee sale is being progressed.
- Over term: Loan has exceeded its contracted maturity date and is performing. Default interest is accruing.
Life to date Defaults
- The net value of Defaults: $238,953
- The net write off rate: 0.06%

The Reserve Funds help protect against defaults
A Reserve Fund has been put in place for each Investment Class to help protect your investment in the event of a late borrower repayment or borrower default. It is funded by applying a reserve levy to the borrower repayment which is aligned to their risk grade and corresponding probability of default.
Whilst the Reserve Fund has ensured that all investor principal and interest due has been repaid in full to date, the Reserve Fund is not an insurance product and we cannot guarantee or warrant that it will have sufficient funds available to enable you to be compensated in event of late borrower repayment or borrower default.
For further detail about how the Reserve Funds operate, including what would happen if a Reserve Fund was depleted, click here.
1An active loan is one that has not been fully repaid or written off.
2Net default rate includes the written off loan amount less any recoveries made on those loans.
3Loans in arrears are defined as loans that are the equivalent of at least 1 monthly repayment behind schedule.
4A loan cohort is the group of loans that were originated within a specific six-month period.
Marlene
New Zealand
I'm loving the interest, that I'm earning on my funds. Questions are answered quickly. Squirrel is very efficient and I'm confident investing with a NZ owned company. I wish I had of invested a year ago. MarleneM
Carole
Hawke’s Bay, New Zealand
Didnt end up investing but i like the whole comcept of peer to peer lending and the fact your a nz company. Will be looking to come back in the futureC

Ajay
Auckland , New Zealand
Quick and effortless onboarding. Excellent transparency & timely communication. One of the best interest rates in the market with timely payments. Well done, Squirrel!A
Sonal
Auckland , New Zealand
Fast & hassle free onboarding. Transparency, communication, and customer support have been excellent! One of the best interest rates in the country, don't know why I didn't join sooner. Highly recommended!S
Sonal
Auckland , New Zealand
Fast & hassle free onbaording. Transparency, communication, and customer support have been excellent! One of the best interest rates in the country, don't know why I didn't join sooner. Highly recommended!S
John A
Canterbury, New Zealand
Quick and easy to invest with an great online web interface and good returns. Now with high interest on the cash account as well.JA
Ian C
Auckland, New Zealand
Always innovating, now we have the on call account earning 3.5%. Even on orders not yet allocated. Thankyou guys.IC
Margaret
Waikato, New Zealand
I really like investing with Squirrel Money. I know my money is safe. There's no fees or terms, which I think is fantastic. And I've got total control of my investments. I can thoroughly recommend Squirrel Money.M
